 English
  Русский
 Bahasa Indonesia
 Bahasa Malay
 ไทย
ไทย Español
 Deutsch
 Български
 Français
 Tiếng Việt
 中文
中文 বাংলা
বাংলা हिन्दी
 Čeština
 Українська
 Română

The Gold price has made new lows earlier today but the oscillators are not following to new lows. The trend remains bearish. There is a bullish wedge pattern in play, and a breakout should signal the start of the next upward leg.
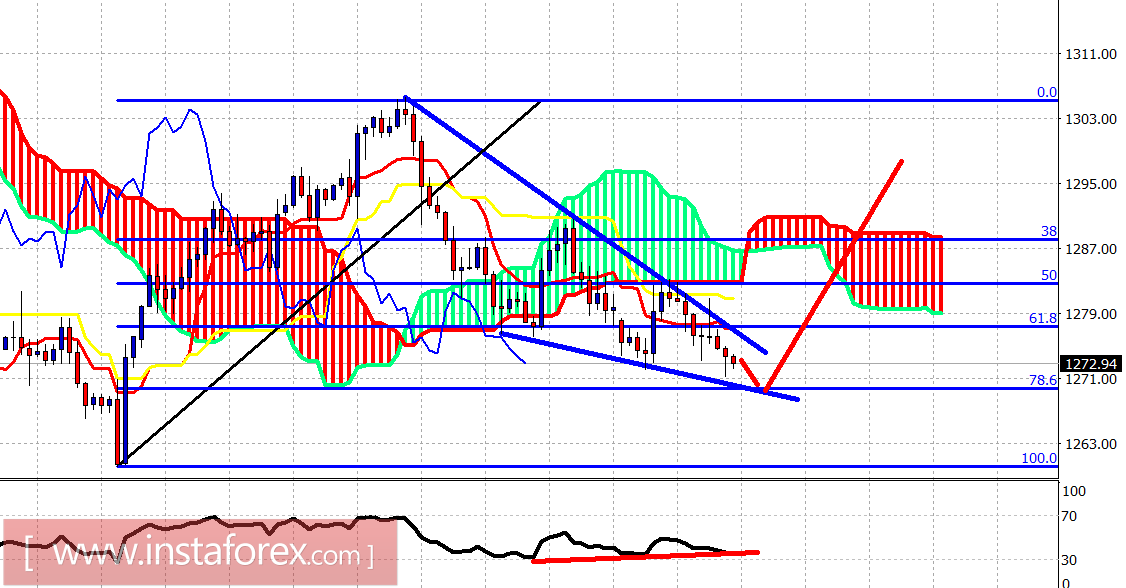
Blue lines - downward sloping wedge
Red lines - expected price path
Gold price is heading towards the lower wedge boundary and the 78.6% Fibonacci retracement. Gold price is expected to touch the trend line and reverse higher. The RSI is diverging and we should soon see an upward reversal. Resistance is at $1,283 and next at $1,290. Support is at $1,271 and next at $1,263.
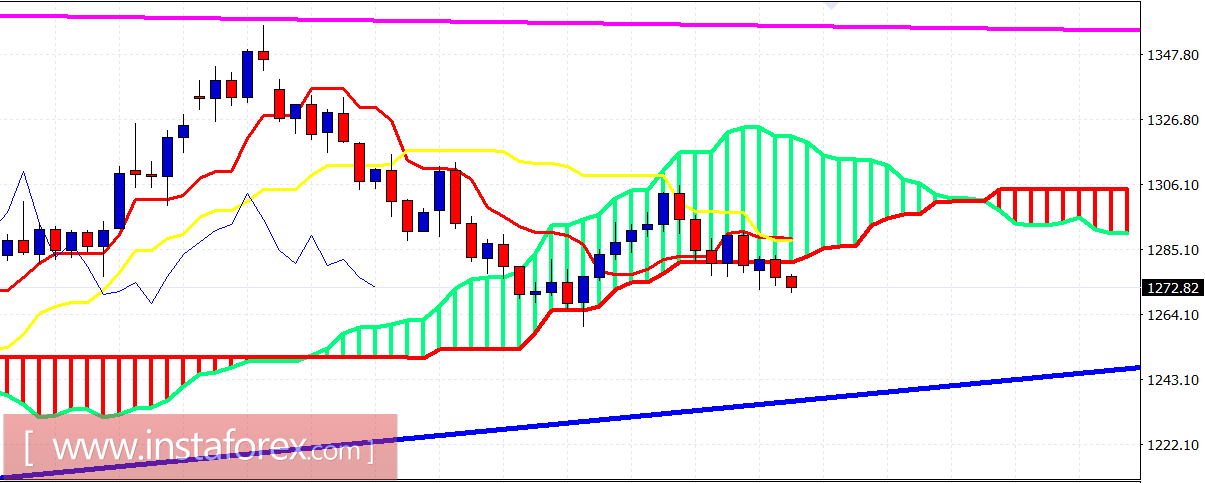
On a daily basis, the trend is now bearish as the price has broken below the Ichimoku cloud. Resistance is at $1,280-85 where the lower boundary of the Kumo is found. Next important resistance is at $1,290. For Gold to be on a bullish trend again, the price must break above the cloud resistance at $1,315. Important longer-term support is found at $1,245-50 where the longer-term blue trend line comes.