 English
  Русский
 Bahasa Indonesia
 Bahasa Malay
 ไทย
ไทย Español
 Deutsch
 Български
 Français
 Tiếng Việt
 中文
中文 বাংলা
বাংলা हिन्दी
 Čeština
 Українська
 Română

USDX remains offered by the resistance level of 94.00 and it's trying to gain momentum in order to continue the bullish path. The price is still above the 200 SMA at H1 chart and if the 94.00 level is broken during the process, the index could scope to test the 94.56 level. MACD indicator remains in favor of the bulls, as long as it stays in the positive territory.
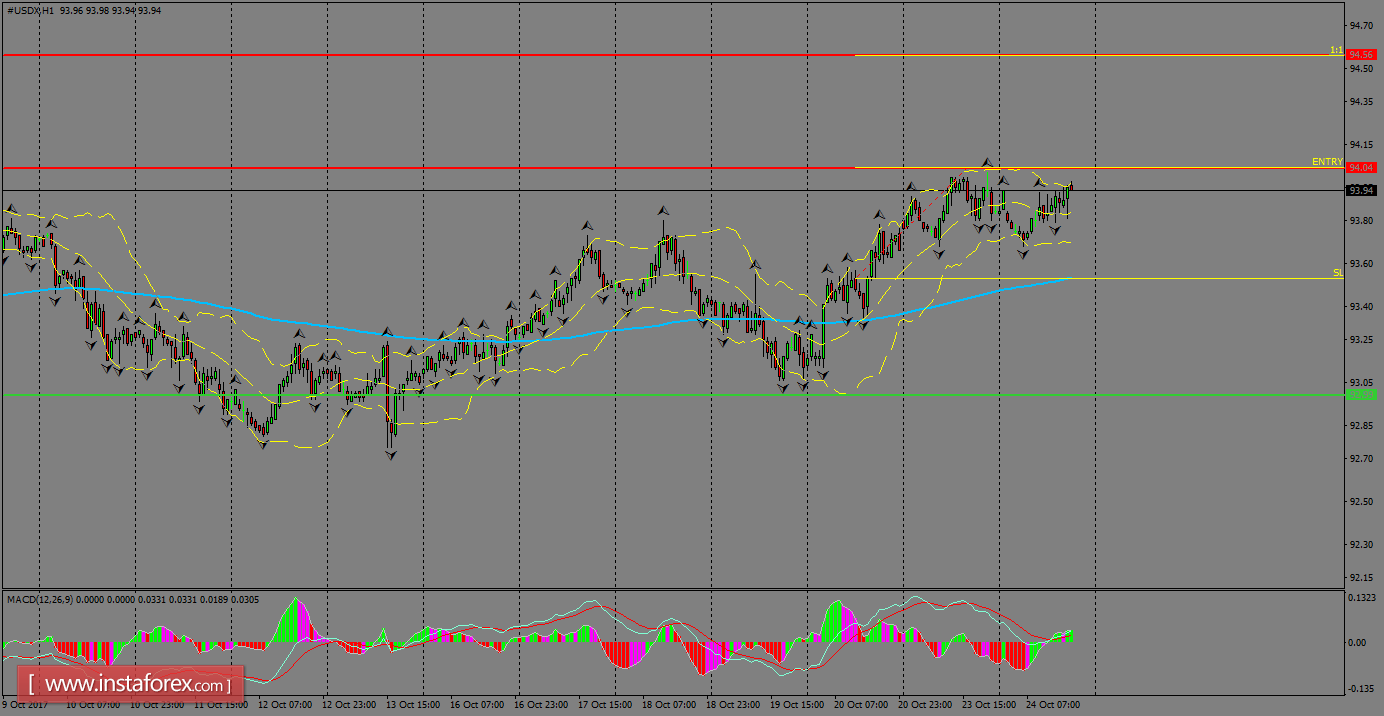
H1 chart's resistance levels: 94.04 / 94.56
H1 chart's support levels: 93.00 / 91.67
Trading recommendations for today: Based on the H1 chart, place buy (long) orders only if the USD Index breaks with a bullish candlestick; the resistance level is at 94.04, take profit is at 94.56 and stop loss is at 93.52.