 English
  Русский
 Bahasa Indonesia
 Bahasa Malay
 ไทย
ไทย Español
 Deutsch
 Български
 Français
 Tiếng Việt
 中文
中文 বাংলা
বাংলা हिन्दी
 Čeština
 Українська
 Română

The Dollar index remains in a bullish trend. Yesterday after reaching new highs at 94 area, price pulled back towards the broken trend line area for a backtest. A bounce off this trend line will increase the bullish scenario strength.
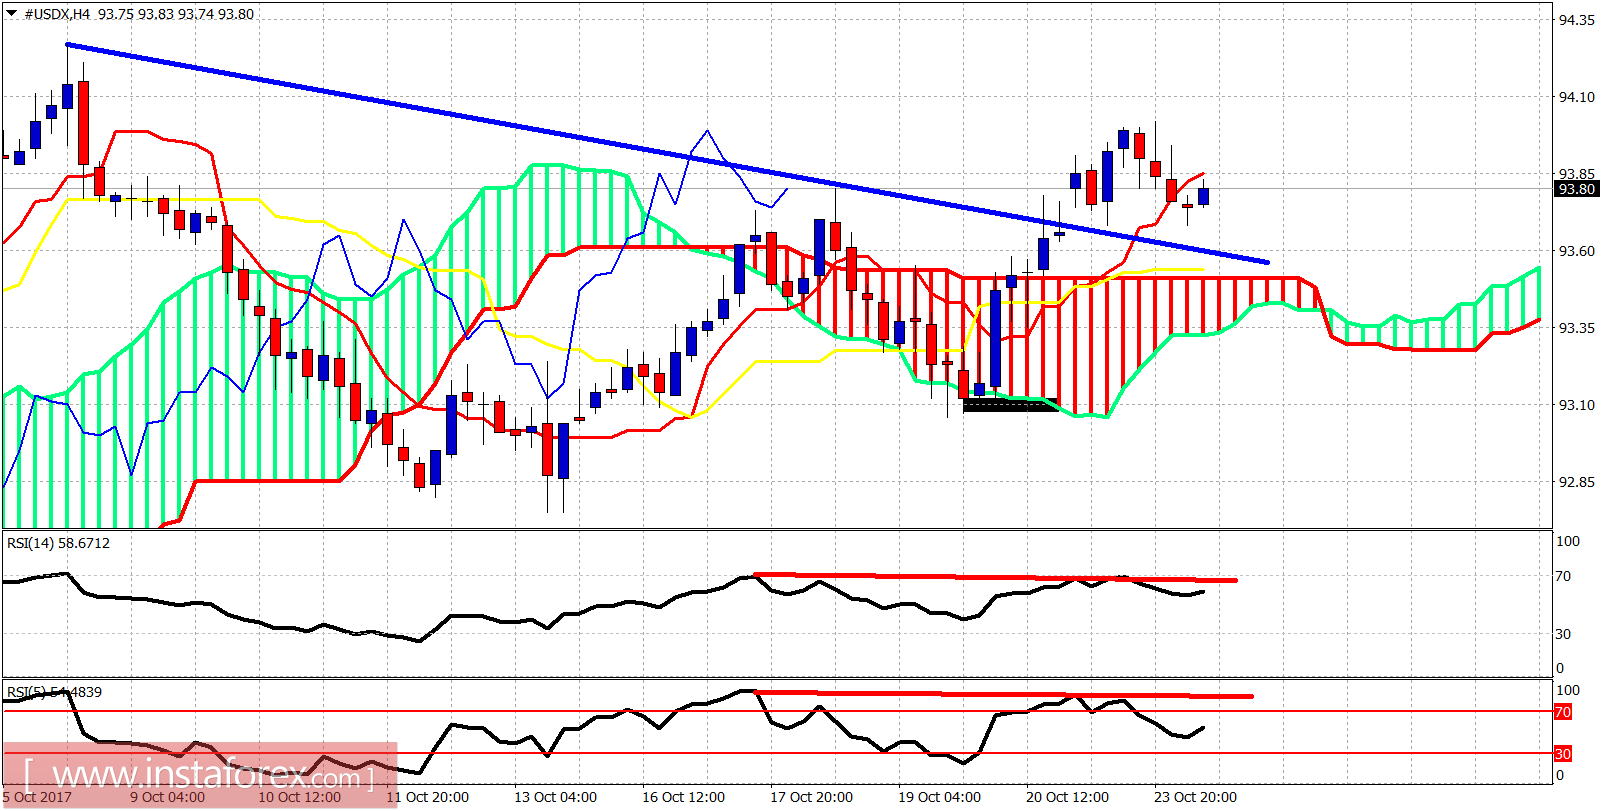
Blue line - resistance (broken)
The Dollar index is trading above the Ichimoku cloud in the 4-hour chart. The trend is bullish as the price is also making higher highs and higher lows. Support is at 93.50 while resistance is at the recent highs at 94. There are some warning divergence signs in the 4-hour chart but as long as the price is above 93, bulls remain in control.
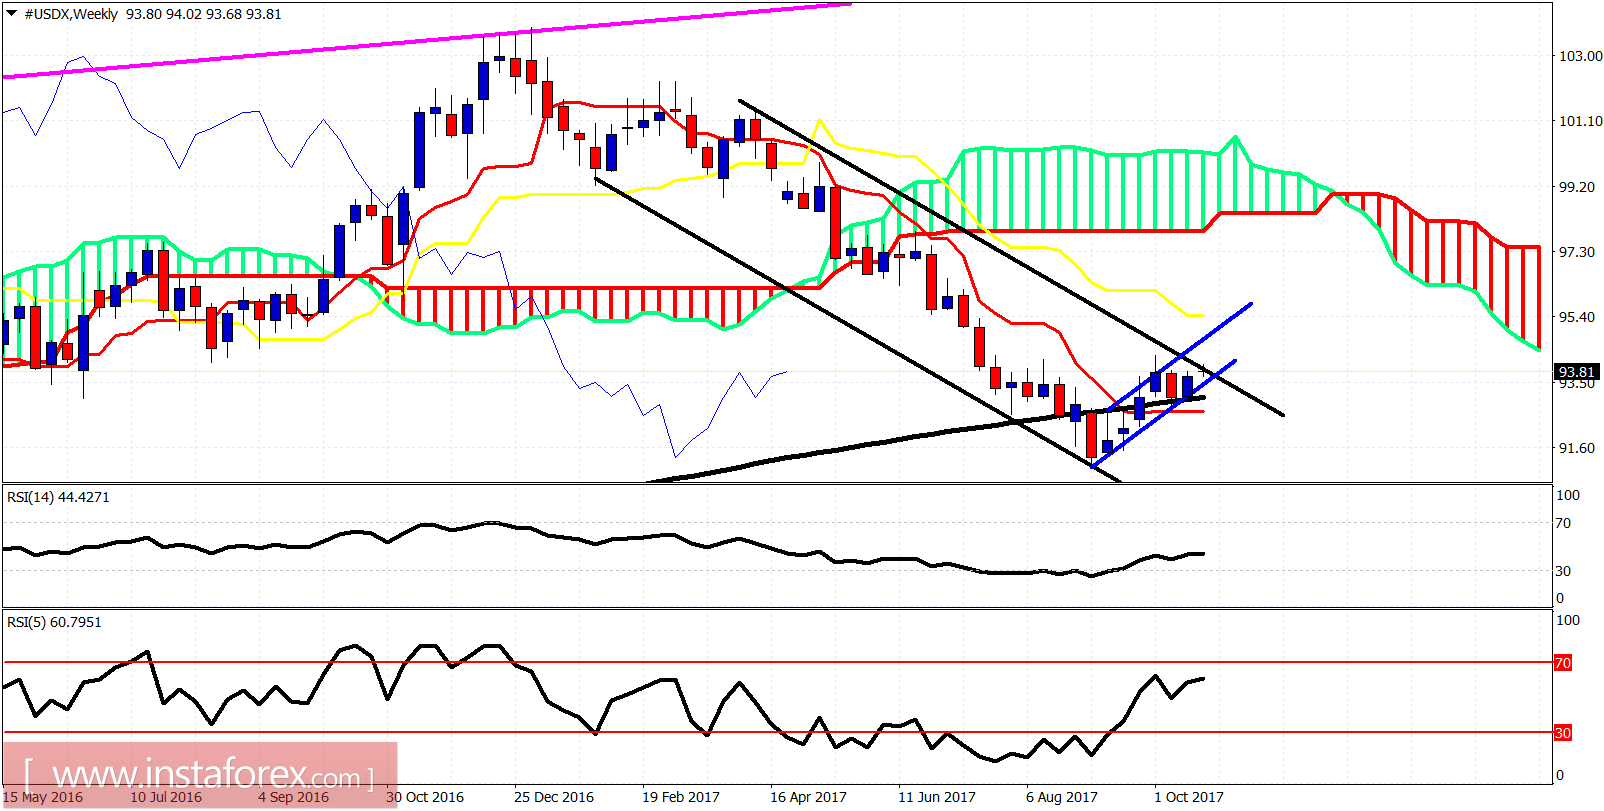
Black lines - bearish channel
Blue lines -bullish channel
The Dollar index remains inside the bearish medium-term and bullish short-term channel. Key levels to watch are at 93.40 and at 94. Price is trading above the tenkan-sen (Red line indicator) and below the kijun-sen (yellow line indicator). The Dollar index could continue higher towards 95 as long as the price is above 93.50-93. If this level is broken, we are starting the next leg down towards 90.