 English
  Русский
 Bahasa Indonesia
 Bahasa Malay
 ไทย
ไทย Español
 Deutsch
 Български
 Français
 Tiếng Việt
 中文
中文 বাংলা
বাংলা हिन्दी
 Čeština
 Українська
 Română

The Gold price has broken out of the downward sloping wedge pattern but has stopped right at the short-term cloud resistance at $1,282. Price needs to break above $1,282 and especially $1,290 for any upward move to consider the start of the next upward move to $1,400.
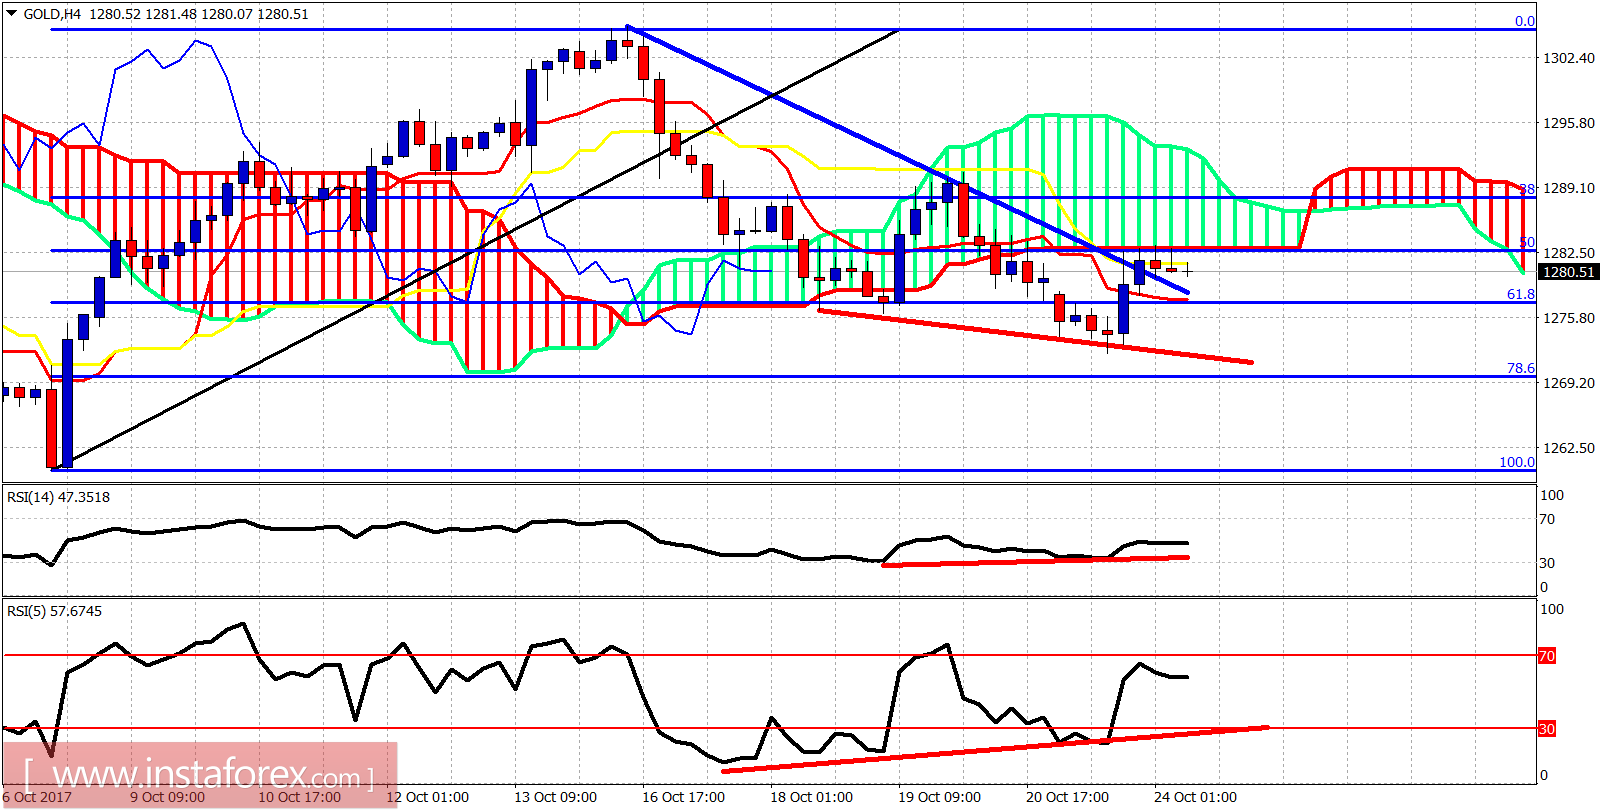
Blue line - resistance (broken)
Red lines - bullish divergence signs
Gold price is trading below the Ichimoku cloud in the 4-hour chart. Price bounced off the 61.8% Fibonacci support area but the important short-term resistance at $1,282 is not clearly broken, Next important resistance for bulls is at $1,290. As long as the price is below that level, we remain in a short-term bearish trend.
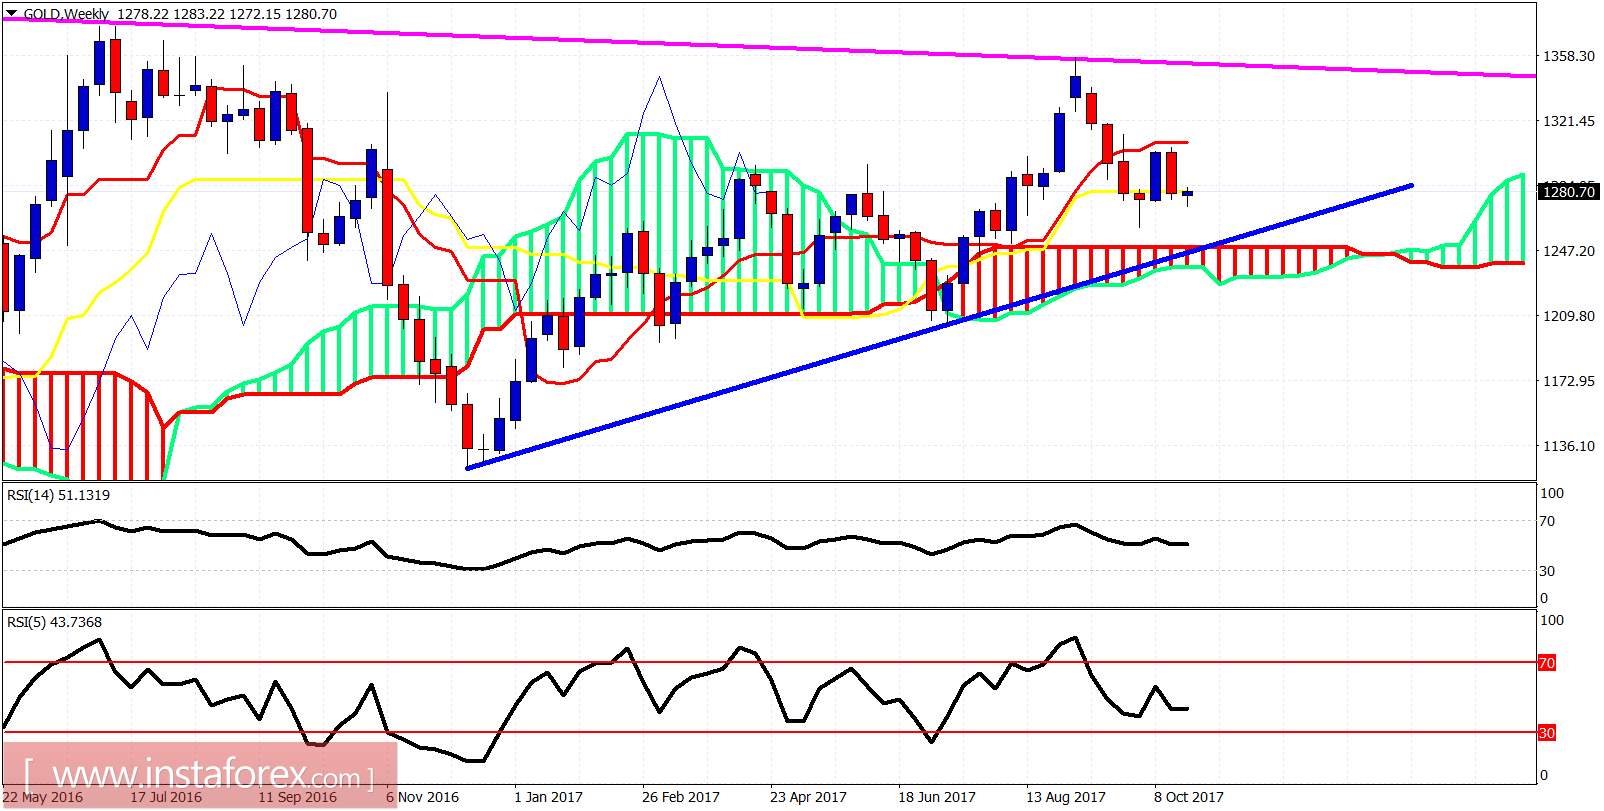
Magenta line - resistance
Blue line - support
On a weekly basis, Gold prices try to move back above the kijun-sen (yellow line indicator). This would be a bullish sign. However, as long as we are trading below the tenkan-sen (red line indicator) there will always be a danger of moving lower towards the weekly Kumo (cloud) and the blue trend line support.