 English
  Русский
 Bahasa Indonesia
 Bahasa Malay
 ไทย
ไทย Español
 Deutsch
 Български
 Français
 Tiếng Việt
 中文
中文 বাংলা
বাংলা हिन्दी
 Čeština
 Українська
 Română

The index has made a rebound above the 200 SMA once again and it's approaching the resistance level of 94.04. With a breakout over that area, we can expect another rally towards the 94.56 zone. To the downside, the moving average mentioned above and the psychological level of 93.00 are the critical supports ahead.
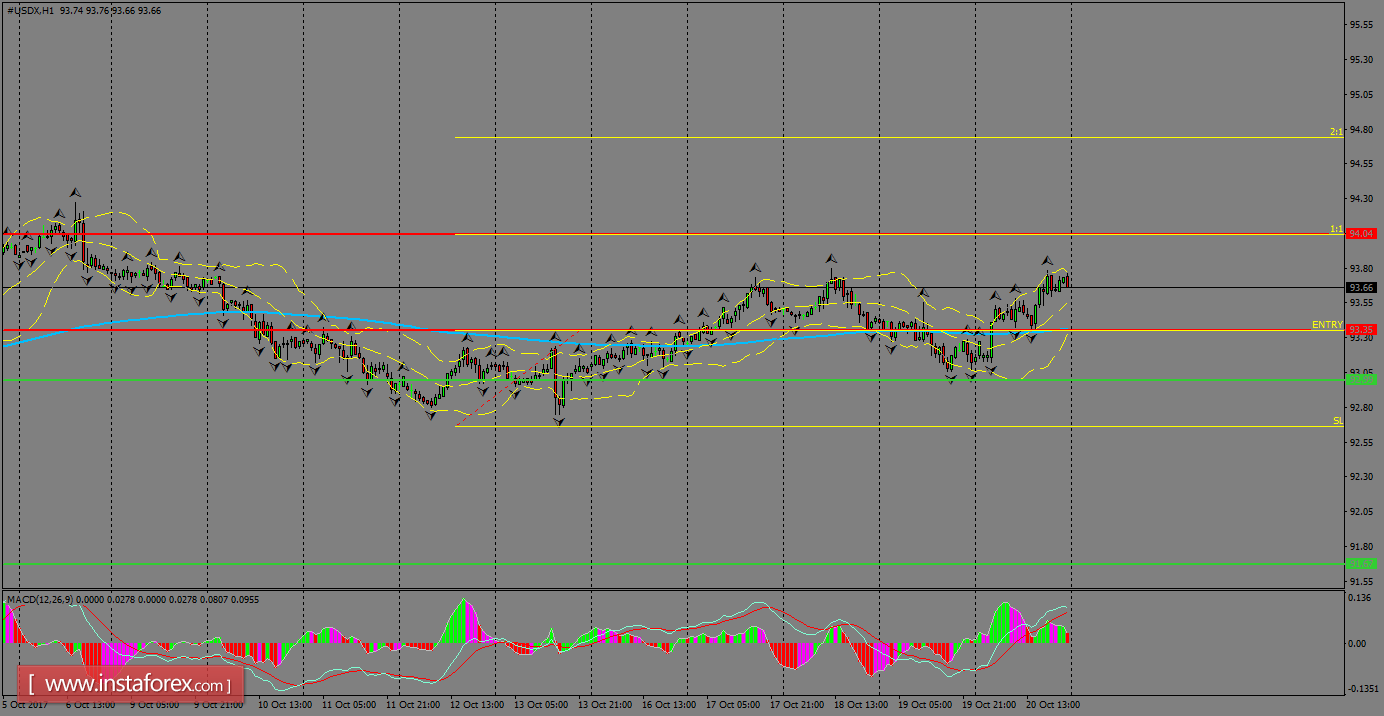
H1 chart's resistance levels: 94.04 / 94.56
H1 chart's support levels: 93.00 / 91.67
Trading recommendations for today: Based on the H1 chart, place buy (long) orders only if the USD Index breaks with a bullish candlestick; the resistance level is at 94.04, take profit is at 94.56 and stop loss is at 93.52.