 English
  Русский
 Bahasa Indonesia
 Bahasa Malay
 ไทย
ไทย Español
 Deutsch
 Български
 Français
 Tiếng Việt
 中文
中文 বাংলা
বাংলা हिन्दी
 Čeština
 Українська
 Română

The 200 SMA at H1 chart continues providing dynamic resistance in the GBP/USD pair and looks forward to reaching the next key support around 1.3037. However, the risk to the upside prevails and if it manages to break above the moving average, we might expect gains toward the resistance level of 1.3309. MACD indicator remains in the neutral territory, calling for sideways moves.
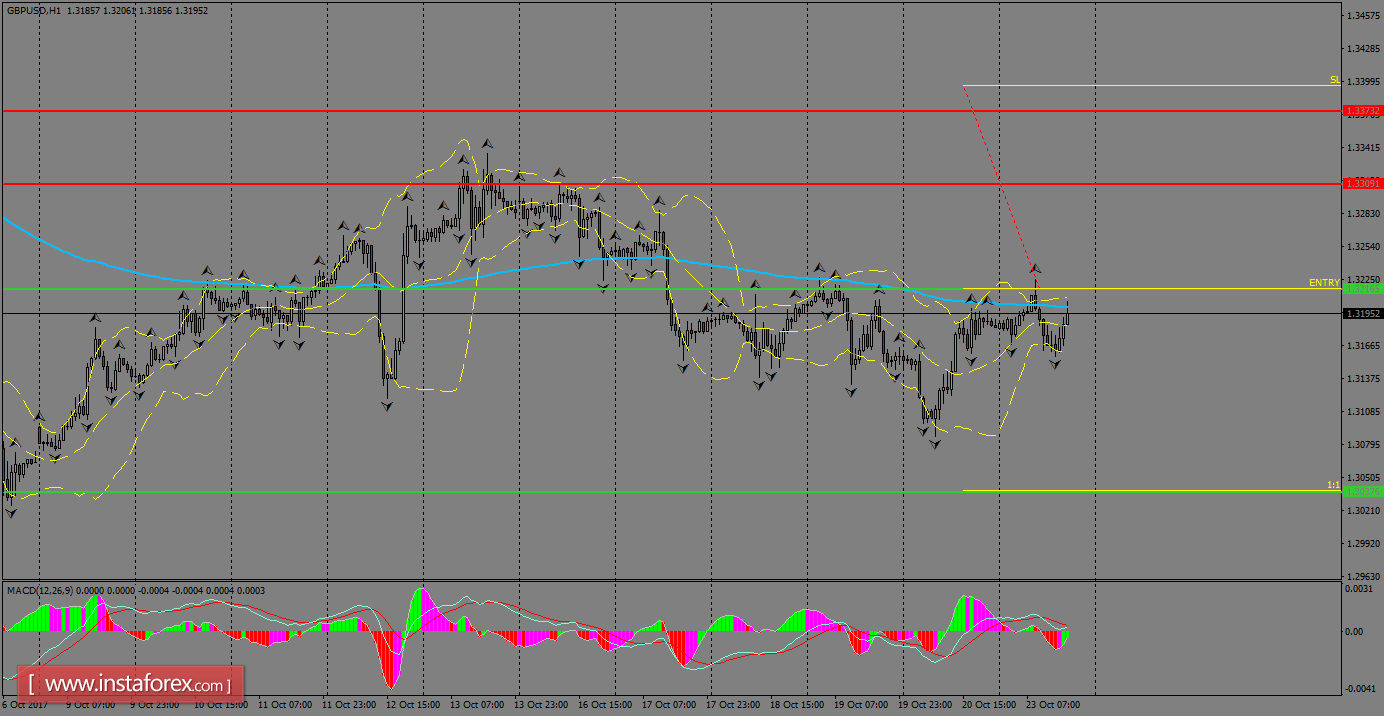
H1 chart's resistance levels: 1.3309 / 1.3373
H1 chart's support levels: 1.3216 / 1.3037
Trading recommendations for today: Based on the H1 chart, sell (short) orders only if the GBP/USD pair breaks a bearish candlestick; the support level is at 1.3216, take profit is at 1.3037 and stop loss is at 1.3398.