 English
  Русский
 Bahasa Indonesia
 Bahasa Malay
 ไทย
ไทย Español
 Deutsch
 Български
 Français
 Tiếng Việt
 中文
中文 বাংলা
বাংলা हिन्दी
 Čeština
 Українська
 Română

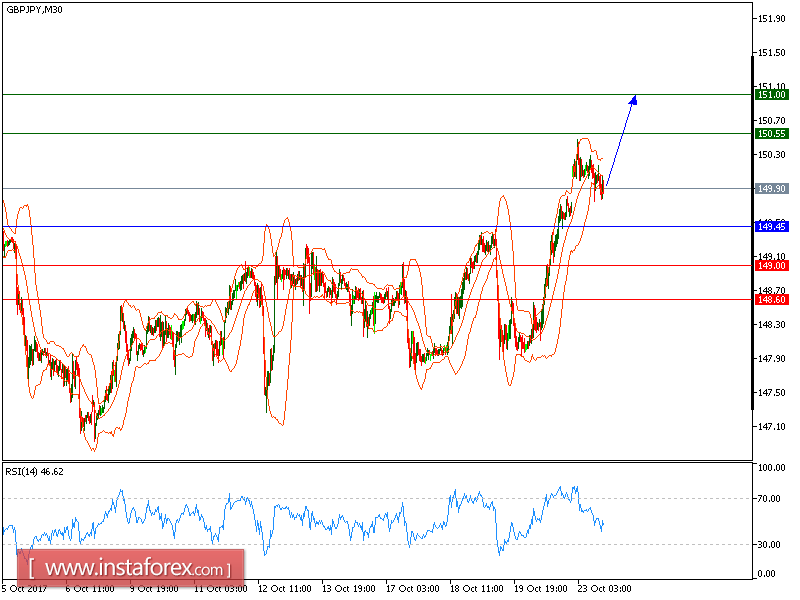
All our targets which we predicted in of Friday's analysis have been hit. GBP/JPY is trading in the upper range and expected to continue the movement. The pair located an intraday key support at 149.45 before bouncing to the upside and trading along the upper Bollinger band. Currently, it has been supported by the rising 20-period moving average, which stands above the 50-period one. The relative strength index remains at levels above the neutrality level of 50, suggesting continued upward momentum for the pair. The intraday outlook remains bullish, and the pair should proceed toward the first upside target at 150.55.
Alternatively, if the price moves in the direction opposite to the forecast, a short position is recommended below 148.20 with the target at 149.40.
Strategy: BUY, Stop Loss: 149.45, Take Profit: 150.55
Chart Explanation: the black line shows the pivot point. The price above the pivot point indicates long positions; and when it is below the pivot points, it indicates short positions. The red lines show the support levels and the green line indicates the resistance levels. These levels can be used to enter and exit trades.
Resistance levels: 150.55, 151.00 and 151.75
Support levels: 149.00, 148.60, and 148.00