 English
  Русский
 Bahasa Indonesia
 Bahasa Malay
 ไทย
ไทย Español
 Deutsch
 Български
 Français
 Tiếng Việt
 中文
中文 বাংলা
বাংলা हिन्दी
 Čeština
 Українська
 Română

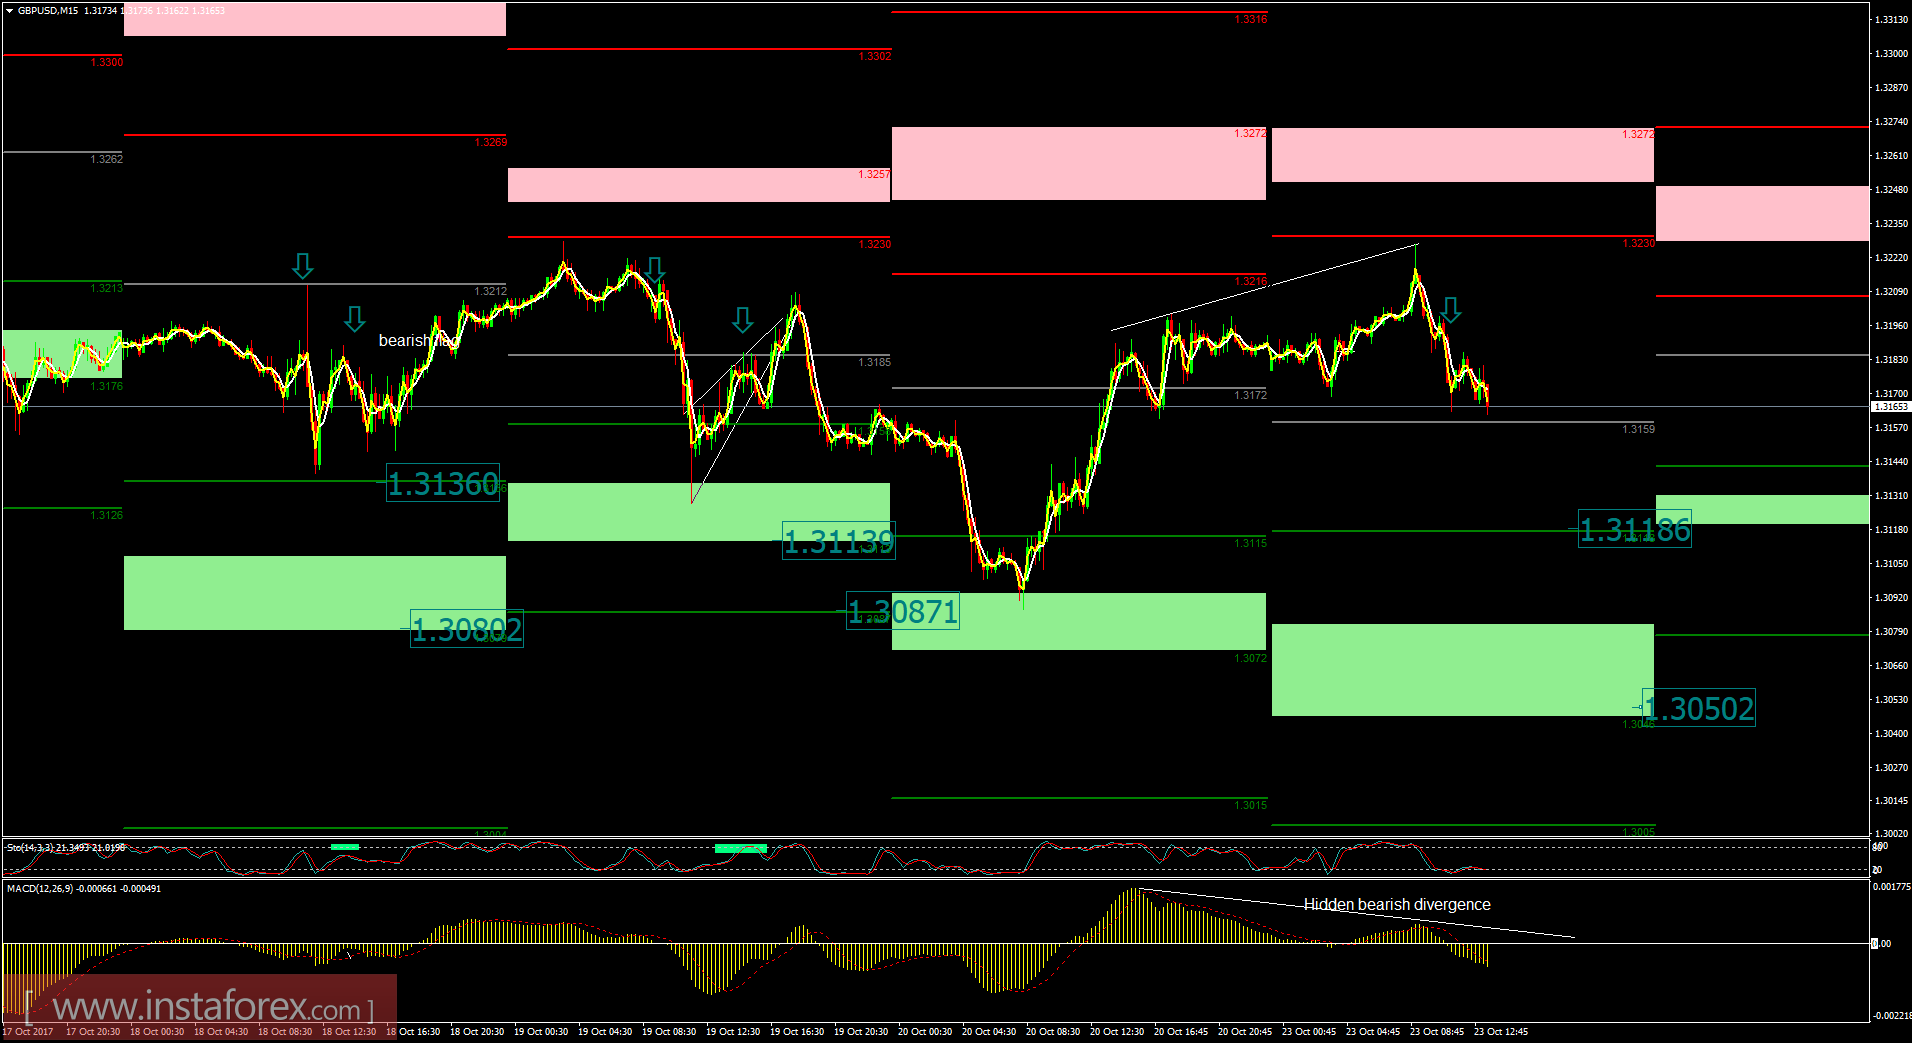
Recently, the GBP/USD pair has been trading sideways at the price of 1.3167. According to the 15M timeframe, I found a successful rejection from the pivot point resistance at the price of 1.3227, which is a sign that buying looks risky. I also found a hidden bearish divergence on the MACD oscilator, which is another sign of weakness. My advice is to watch for potential selling opportuntiies. The downward targets are set at the price of 1.3119 (S1) and 1.3050 (S2).
Resistance levels:
R1: 1.3230
R2: 1.3270
R3: 1.3343
Support levels:
S1: 1.3118
S2: 1.3050
S3: 1.3005
Trading recommendations for today: watch for potential selling opportunities.