 English
  Русский
 Bahasa Indonesia
 Bahasa Malay
 ไทย
ไทย Español
 Deutsch
 Български
 Français
 Tiếng Việt
 中文
中文 বাংলা
বাংলা हिन्दी
 Čeština
 Українська
 Română

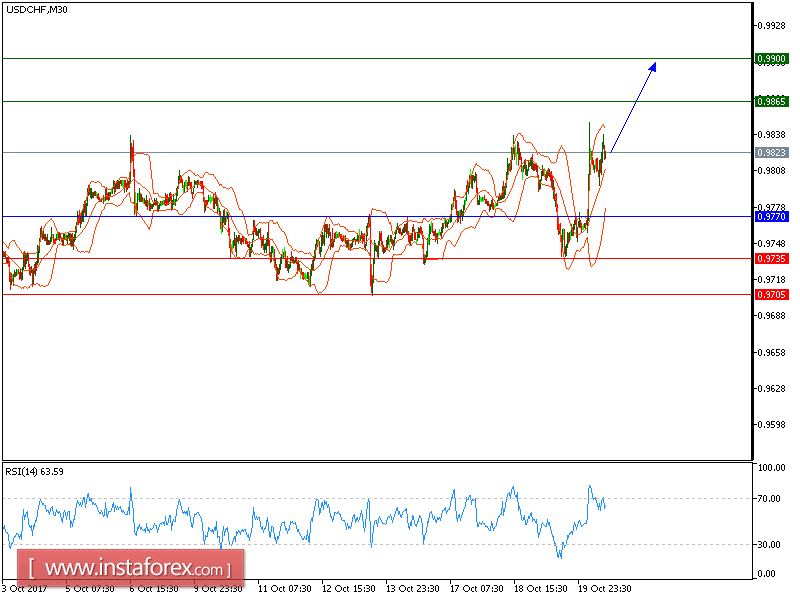
USD/CHF is expected to continue the upside movement. The pair posted a double bottom pattern and broke above its key resistance at 0.9770, which becomes the key support. The upward momentum is further reinforced by both rising 20-period and 50-period moving averages. The relative strength index lacks downward momentum.
To conclude, above 0.9770, look for a new challenge with targets at 0.9865 and 0.9900 in extension.
Chart Explanation: The black line shows the pivot point. The present price above the pivot point indicates a bullish position, and the price below the pivot points indicates a short position. The red lines show the support levels and the green line indicates the resistance levels. These levels can be used to enter and exit trades.
Strategy: BUY, Stop Loss: 0.9770, Take Profit: 0.9865
Resistance levels: 0.9865, 0.9900, and 0.9930
Support levels: 0.9735, 0.9705, and 0.966 0