 English
  Русский
 Bahasa Indonesia
 Bahasa Malay
 ไทย
ไทย Español
 Deutsch
 Български
 Français
 Tiếng Việt
 中文
中文 বাংলা
বাংলা हिन्दी
 Čeština
 Українська
 Română

Overview:
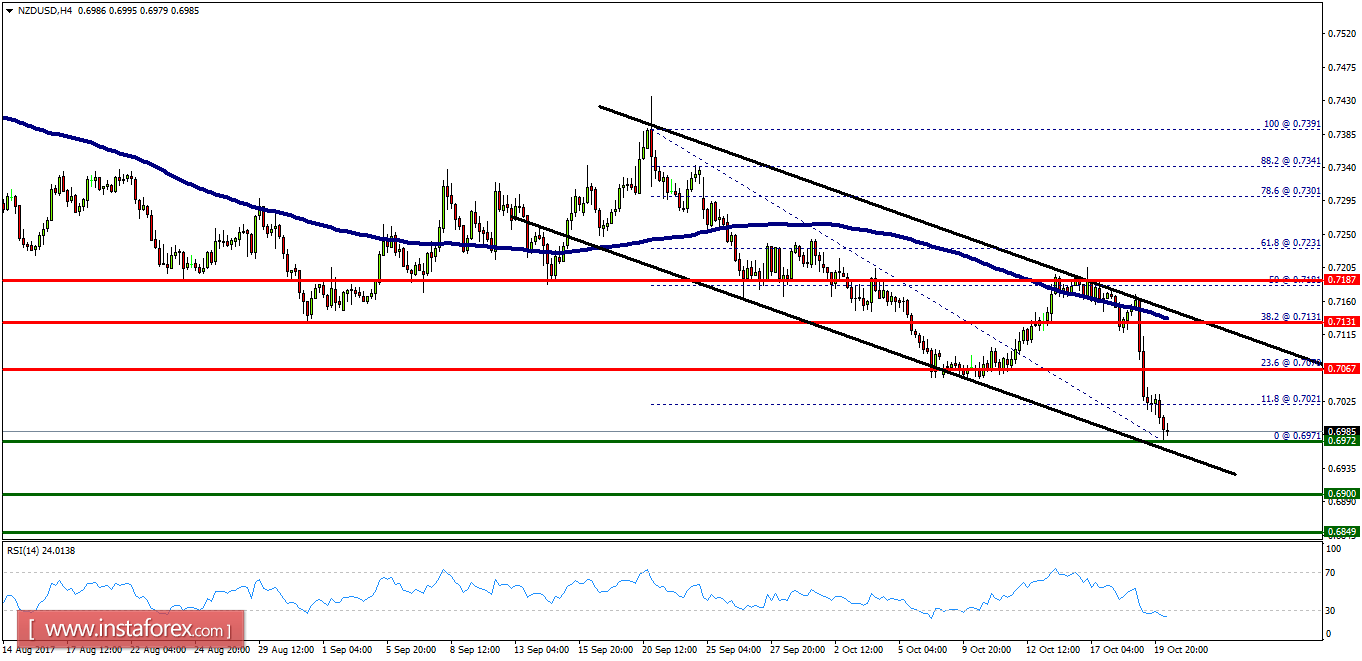
- The NZD/USD pair has dropped sharply from the level of 0.7067 towards 0.6972. Now, the price is set at 0.6985 to act as a minor suport. It should be noted that volatility is very high for that the NZD/USD pair is still moving between 0.7020 and 0.6900 in coming hours. Furthermore, the price has been set below the strong resistance at the levels of 0.7020 and 0.7067, which coincides with the 23.6% Fibonacci retracement level. Additionally, the price is in a bearish channel now. Amid the previous events, the pair is still in a downtrend. From this point, the NZD/USD pair is continuing in a bearish trend from the new resistance of 0.7067. Thereupon, the price spot of 0.7067 remains a significant resistance zone. Therefore, a possibility that the NZD/USD pair will have downside momentum is rather convincing and the structure of a fall does not look corrective. In order to indicate a bearish opportunity below 0.7067, sell below 0.7067 or 0.7021 with the first targets at 0.6900 and 0.6849. However, the stop loss should be located above the level of 0.7070.