 English
  Русский
 Bahasa Indonesia
 Bahasa Malay
 ไทย
ไทย Español
 Deutsch
 Български
 Français
 Tiếng Việt
 中文
中文 বাংলা
বাংলা हिन्दी
 Čeština
 Українська
 Română

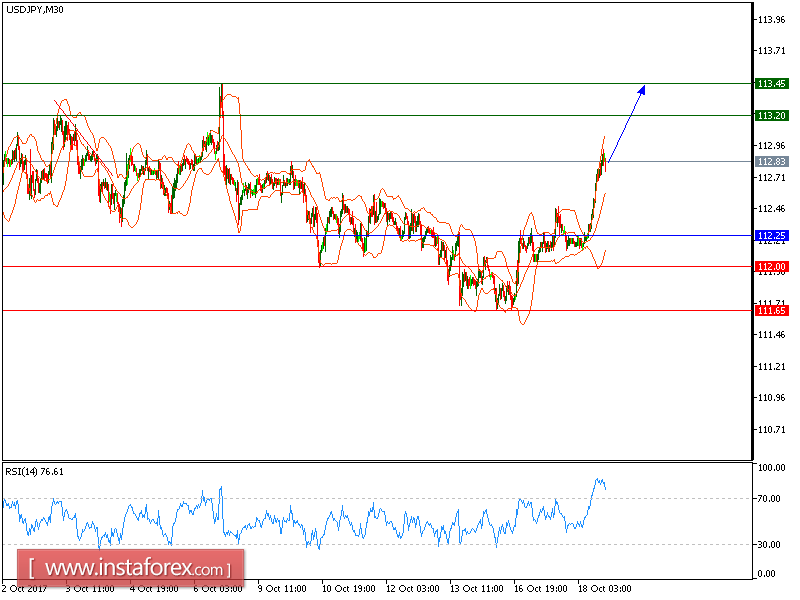
USD/JPY is expected to continue its upside movement. Despite the pair retreated from 112.45 (the high of October 17), a support base at 112.25 has formed and has allowed for a temporary stabilization. Even though a continuation of consolidation cannot be ruled out, its extent should be limited.
Hence, as long as 112.25 is not broken, look for a further upside with targets at 113.20 and 113.45 in extension.
Alternatively, if the price moves in the opposite direction, a short position is recommended below 112.25 with a target at 112.00.
Chart Explanation: The black line shows the pivot point. The current price above the pivot point indicates a bullish position, while the price below the pivot point is a signal for a short position. The red lines show the support levels and the green line indicates the resistance level. These levels can be used to enter and exit trades.
Strategy: BUY, Stop Loss: 112.25, Take Profit: 113.20
Resistance levels: 113.20, 113.45 and 113.75 Support Levels: 112.00, 111.65, 111.25