 English
  Русский
 Bahasa Indonesia
 Bahasa Malay
 ไทย
ไทย Español
 Deutsch
 Български
 Français
 Tiếng Việt
 中文
中文 বাংলা
বাংলা हिन्दी
 Čeština
 Українська
 Română

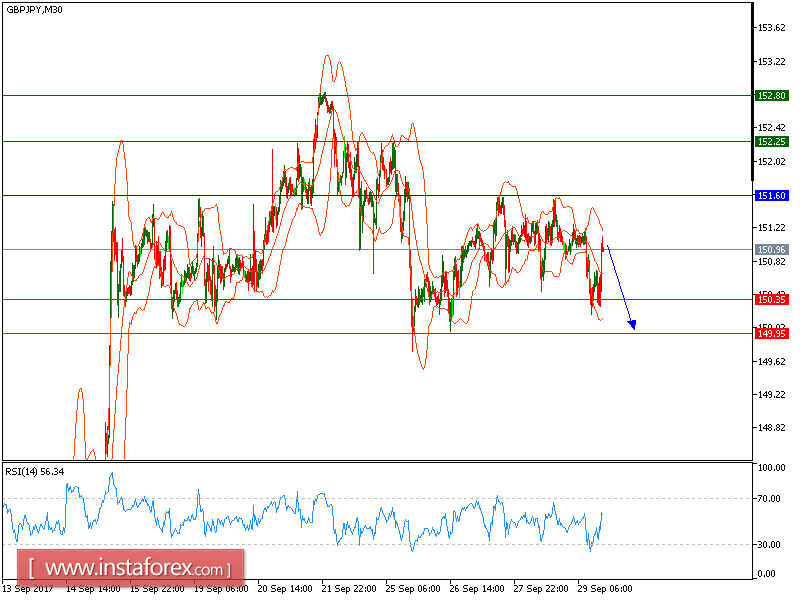
GBP/JPY is expected to trade with a bearish bias below 151.60. The pair has clearly turned down, and remains capped by its falling 20-period and 50-period moving averages. The nearest resistance at 1.2475 maintains the strong selling pressure on the prices. Besides, the relative strength index is still below its neutrality area at 50.
In which case, as long as 151.60 is not surpassed, look for a return to 150.35 at first. A break below 150.35 would trigger a drop towards 149.95.
Alternatively, if the price moves in the direction opposite to the forecast, a long position is recommended above 152.25 with the target at 152.80.
Strategy: SELL, Stop Loss: 151.60, Take Profit: 150.35
Chart Explanation: the black line shows the pivot point. The price above the pivot point indicates long positions; and when it is below the pivot points, it indicates short positions. The red lines show the support levels and the green line indicates the resistance levels. These levels can be used to enter and exit trades.
Resistance levels: 152.25, 152.80 and 153.25
Support levels: 150.35, 149.95, and 149.15