English
  Русский
 Bahasa Indonesia
 Bahasa Malay
 ไทย
ไทย Español
 Deutsch
 Български
 Français
 Tiếng Việt
 中文
中文 বাংলা
বাংলা हिन्दी
 Čeština
 Українська
 Română

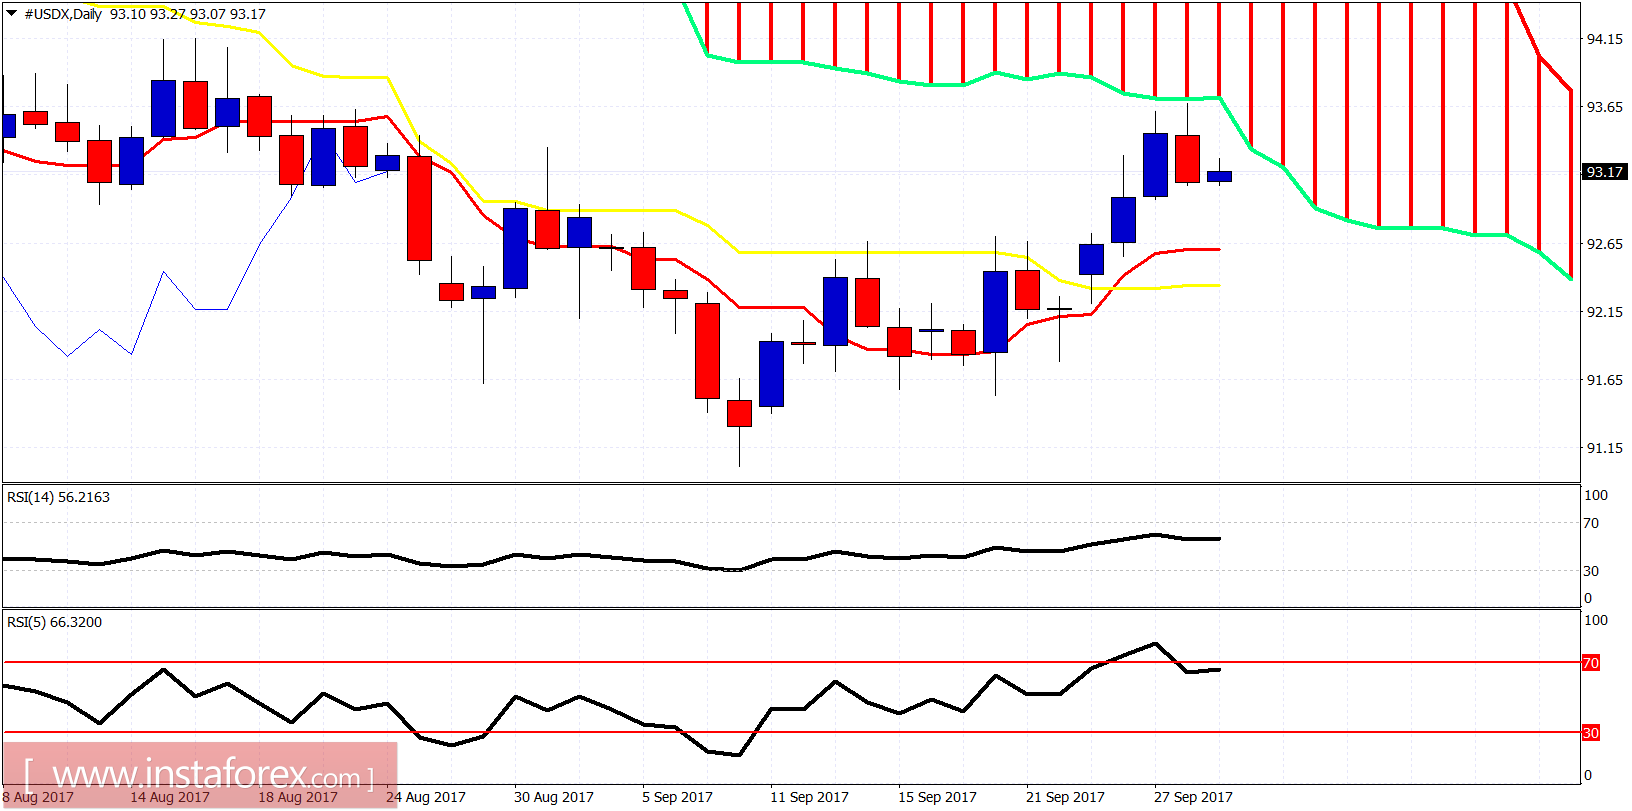
The Dollar index made a pullback yesterday after being rejected at the daily cloud resistance of 93.70 as we expected. Short-term trend remains bullish and the current downward move is still considered a pullback. However I believe that this downward move will soon accelerate.
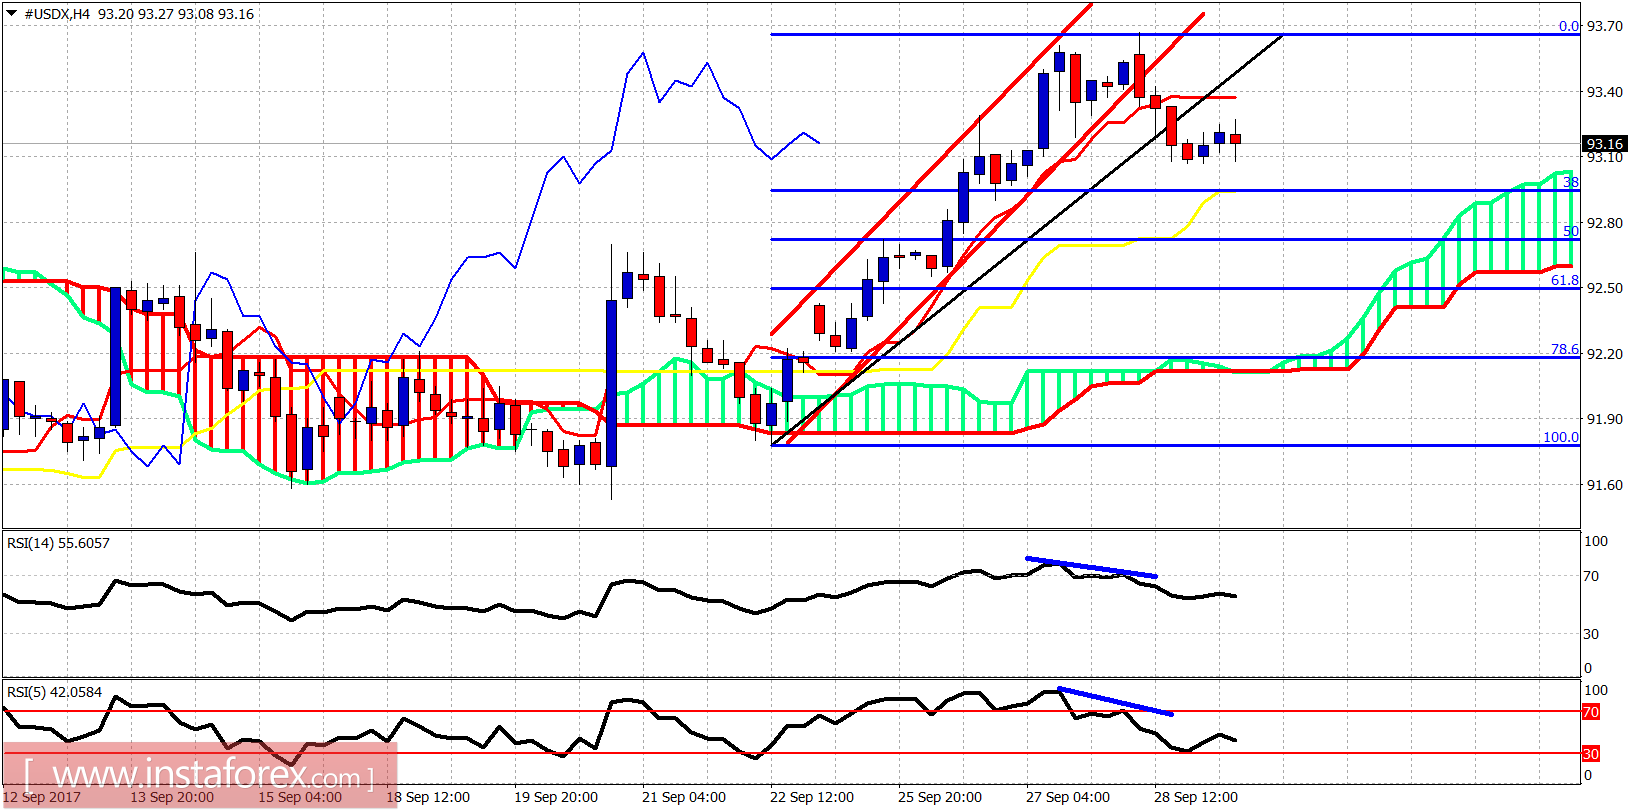
The Dollar index has broken down and out of the bullish channel. This at least will bring a corrective pullback towards the 38% Fibonacci retracement. The 38% Fibonacci retracement at 92.95 is the first important short-term support. Next support is at 92.50 (61.8% Fibonacci retracement).