 English
  Русский
 Bahasa Indonesia
 Bahasa Malay
 ไทย
ไทย Español
 Deutsch
 Български
 Français
 Tiếng Việt
 中文
中文 বাংলা
বাংলা हिन्दी
 Čeština
 Українська
 Română

The index is in a decisive stage where bulls could decide the next path or bears could take control of the situation. The support level of 93.09 still remains as a critical level ahead of the 200 SMA as dynamic support as well. To the upside, if USDX breaks above 94.04, bulls could be consolidating in the short-term.
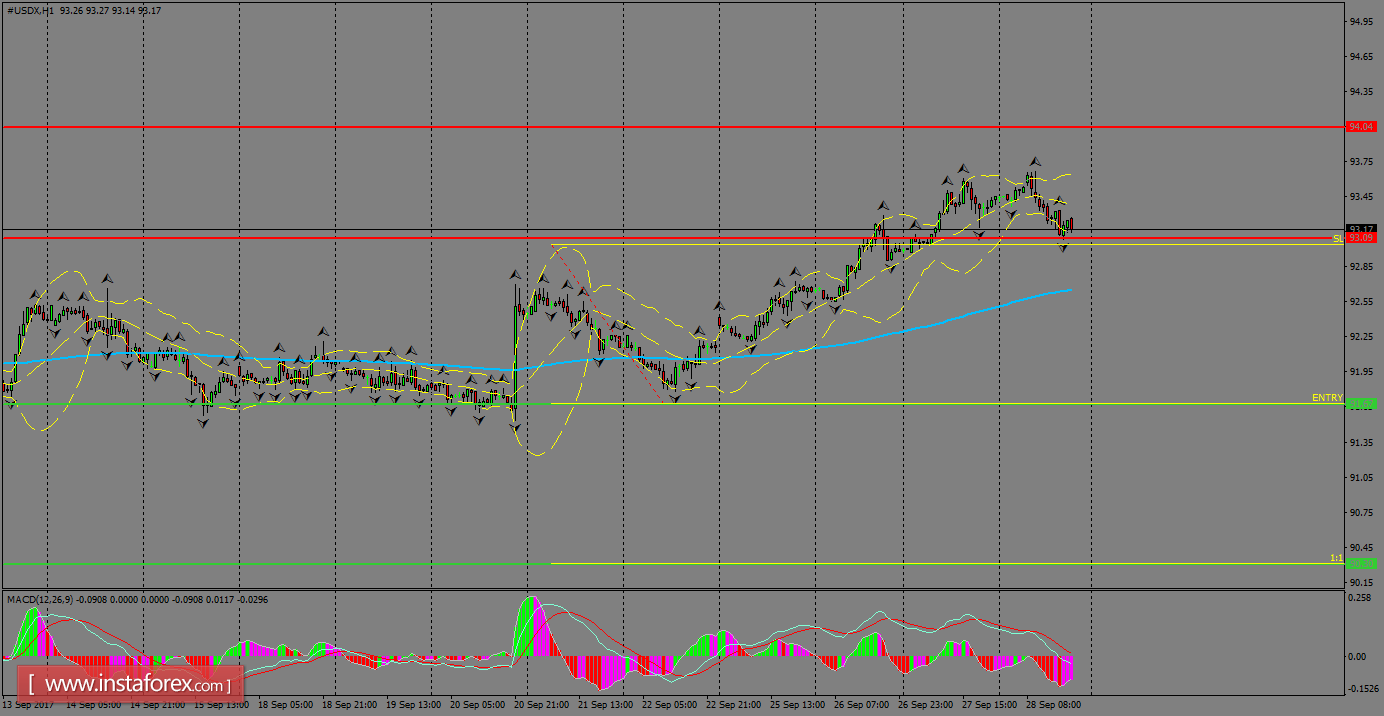
H1 chart's resistance levels: 93.09 / 94.04
H1 chart's support levels: 91.67 / 90.30
Trading recommendations for today: Based on the H1 chart, place sell (short) orders only if the USD Index breaks with a bearish candlestick; the support level is at 91.67, take profit is at 90.30 and stop loss is at 93.04.