 English
  Русский
 Bahasa Indonesia
 Bahasa Malay
 ไทย
ไทย Español
 Deutsch
 Български
 Français
 Tiếng Việt
 中文
中文 বাংলা
বাংলা हिन्दी
 Čeština
 Українська
 Română

The pair made another low below the 200 SMA at H1 chart, but now it's looking to break above that moving average once again. Nearest support lies at 1.3309, where bulls could gather momentum in order to ride the bullish path across the board. If the level of 1.3309 gives up, we can expect another leg lower towards 1.3209.
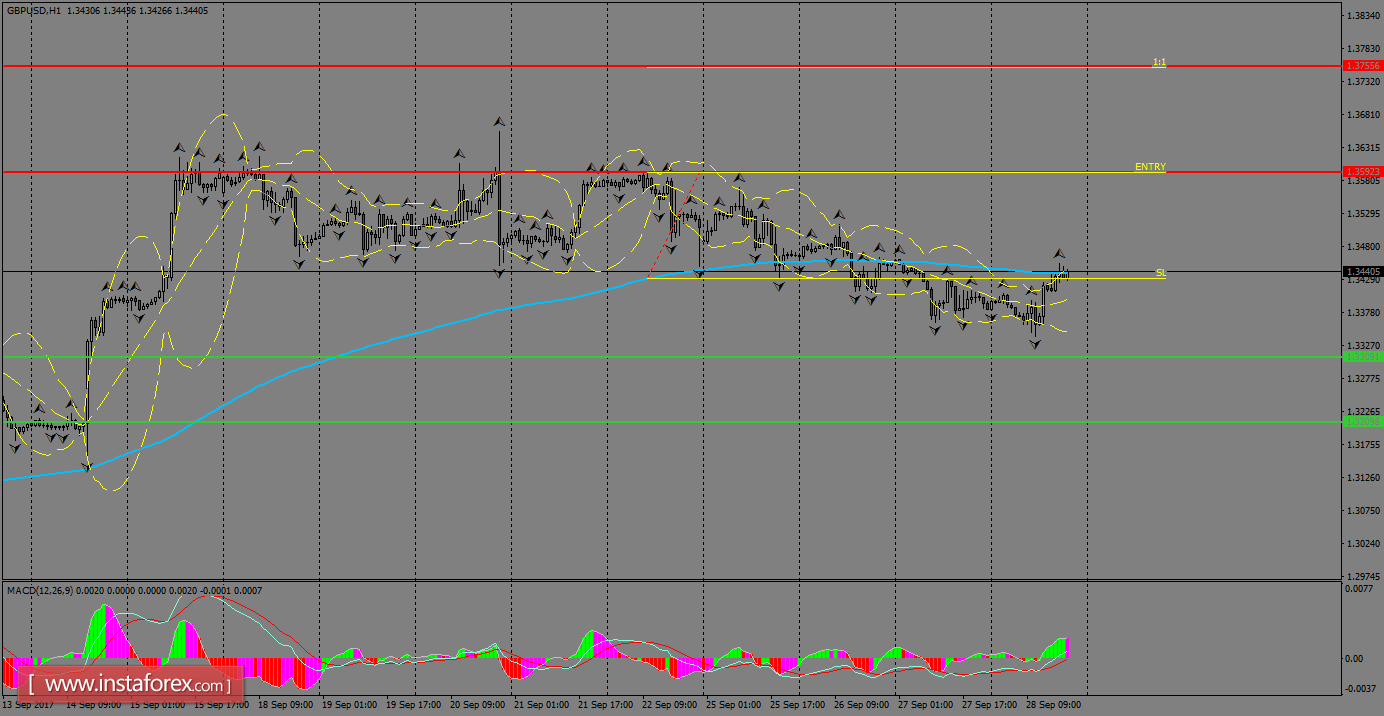
H1 chart's resistance levels: 1.3592 / 1.3755
H1 chart's support levels: 1.3309 / 1.3209
Trading recommendations for today: Based on the H1 chart, buy (long) orders only if the GBP/USD pair breaks a bullish candlestick; the resistance level is at 1.3592, take profit is at 1.3755 and stop loss is at 1.3430.