 English
  Русский
 Bahasa Indonesia
 Bahasa Malay
 ไทย
ไทย Español
 Deutsch
 Български
 Français
 Tiếng Việt
 中文
中文 বাংলা
বাংলা हिन्दी
 Čeština
 Українська
 Română

Analyzing Thursday's trades:
EUR/USD on 1H chart
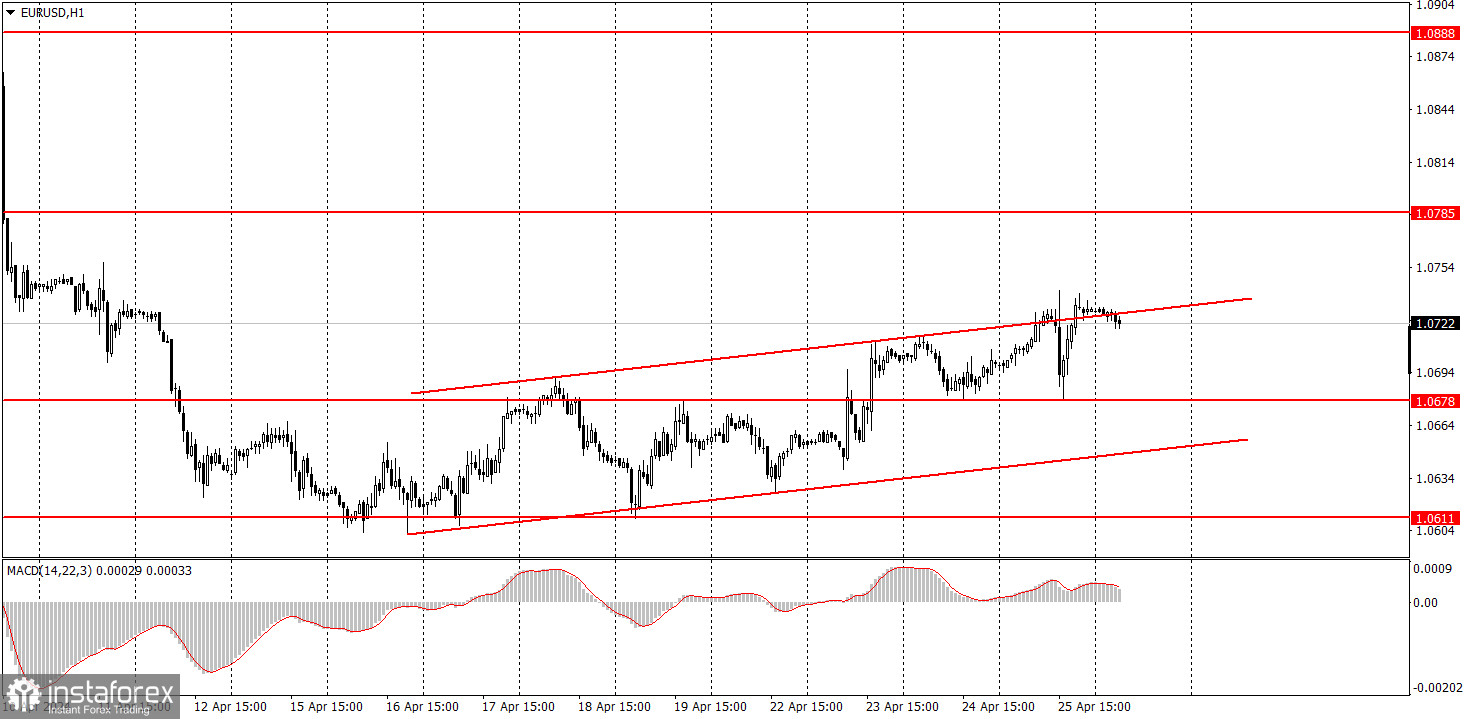
EUR/USD continued to trade within an ascending channel on Thursday. The pair repeatedly changed direction. The US GDP report was partly responsible for this, which turned out to be significant and also highly contradictory. As a result, the market initially bought the pair, then panicked and sold it, and eventually bought it again. The US economy grew by just 1.6% in the first quarter, significantly below forecasts. However, on an annual basis, the economy grew by 3.1%, exceeding market expectations. This is why the market initially bought the dollar and then sold it. It simply couldn't determine whether the report was positive or negative. We also find it difficult to answer this question. We believe that the main point is that the pair is correcting higher, and the dollar can easily rise once this phase ends.
EUR/USD on 5M chart
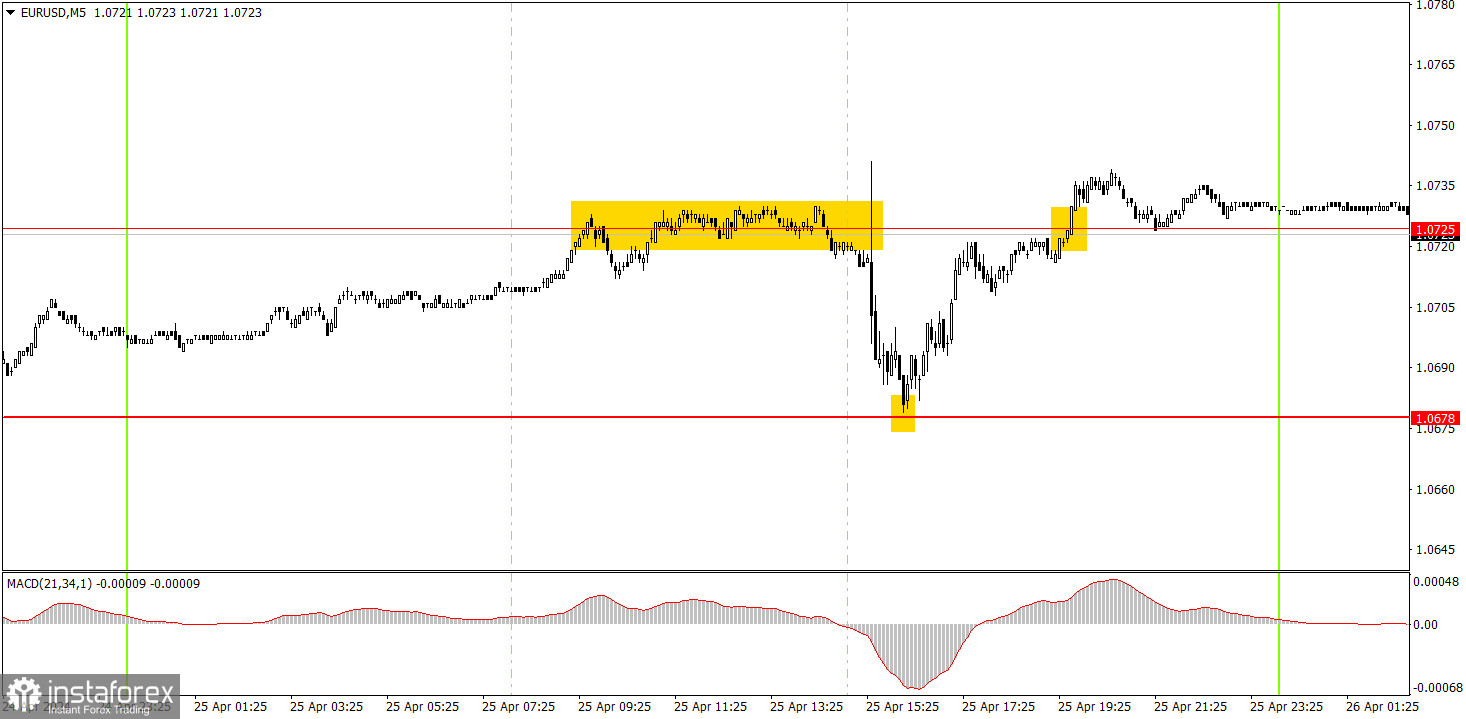
Several trading signals were generated on the 5-minute timeframe. Throughout the European session, the pair couldn't decide where to move from the level of 1.0725. Eventually, there was a rebound from this level and the price dropped to the target of 1.0678. This was the first signal to execute, which resulted in a profit of about 25 pips. The rebound from the level of 1.0678 was to be executed using a long position, and by evening, the price returned to the level of 1.0725, so beginners could earn another 30 pips of profit.
Trading tips on Friday:
On the hourly chart, the downtrend persists, but the EUR/USD pair is currently correcting higher. We believe that the euro should fall further, as it is still too high, and in general, the trend is headed downwards. However, at the moment, the market is likely taking a break before it starts a new downward movement.
Today, the pair may fall as it is currently near the upper boundary of the channel. Yesterday, the US GDP report prevented the decline, and today, the Personal Consumption Expenditures Price Index and the Consumer Sentiment Index in the US may hinder it. Nevertheless, we do not expect a strong rise.
The key levels on the 5M chart are 1.0483, 1.0526, 1.0568, 1.0611, 1.0678, 1.0725, 1.0785-1.0797, 1.0838-1.0856, 1.0888-1.0896, 1.0940, 1.0971-1.0981. There are no significant events planned in the European Union, while the US will release reports on Personal Income and Outlays, Consumer Sentiment Index, and Personal Consumption Expenditures Price Index. Together, these indices may influence market sentiment.
Basic trading rules:
1) Signal strength is determined by the time taken for its formation (either a bounce or level breach). A shorter formation time indicates a stronger signal.
2) If two or more trades around a certain level are initiated based on false signals, subsequent signals from that level should be disregarded.
3) In a flat market, any currency pair can produce multiple false signals or none at all. In any case, the flat trend is not the best condition for trading.
4) Trading activities are confined between the onset of the European session and mid-way through the U.S. session, after which all open trades should be manually closed.
5) On the 30-minute timeframe, trades based on MACD signals are only advisable amidst substantial volatility and an established trend, confirmed either by a trendline or trend channel.
6) If two levels lie closely together (ranging from 5 to 15 pips apart), they should be considered as a support or resistance zone.
How to read charts:
Support and Resistance price levels can serve as targets when buying or selling. You can place Take Profit levels near them.
Red lines represent channels or trend lines, depicting the current market trend and indicating the preferable trading direction.
The MACD(14,22,3) indicator, encompassing both the histogram and signal line, acts as an auxiliary tool and can also be used as a signal source.
Significant speeches and reports (always noted in the news calendar) can profoundly influence the price dynamics. Hence, trading during their release calls for heightened caution. It may be reasonable to exit the market to prevent abrupt price reversals against the prevailing trend.
Beginning traders should always remember that not every trade will yield profit. Establishing a clear strategy coupled with sound money management is the cornerstone of sustained trading success.