 English
  Русский
 Bahasa Indonesia
 Bahasa Malay
 ไทย
ไทย Español
 Deutsch
 Български
 Français
 Tiếng Việt
 中文
中文 বাংলা
বাংলা हिन्दी
 Čeština
 Українська
 Română

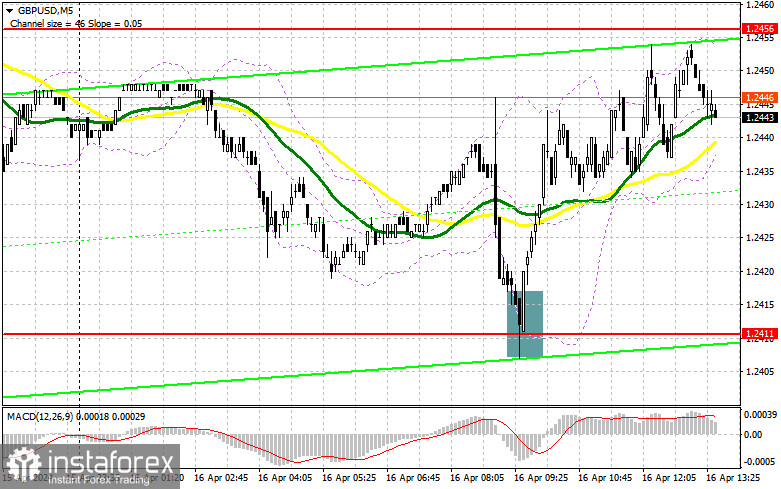
In my morning forecast, I pointed out the level of 1.2411 and planned to make decisions based on it for market entry. Let's take a look at the 5-minute chart and figure out what happened there. The decline and the formation of a false breakout there led to a buy signal, resulting in the pair rising by almost 40 points. The technical picture remained unchanged for the second half of the day.
To open long positions on GBP/USD:
At the moment, the British pound reacted with a drop to news that the unemployment rate in the UK sharply increased; however, buyers took advantage of this and managed to defend the monthly minimum, providing an excellent buying point for the pound. But, as you can see on the chart, the initiative quickly faded, and the pair failed to break out above the resistance at 1.2456, which will be the focus for the second half of the day. Also ahead of us are figures on the volume of building permits issued in the US, the number of new foundations laid, and changes in industrial production. Strong data may lead to another breakdown around 1.2411, where I will act similarly to what I described above. A false breakout around 1.2411 will provide an entry point for buying with the aim of rising to the resistance at 1.2465, which we did not reach in the first half of the day. There are also moving averages located there, playing in favor of sellers. A breakout and a test from top to bottom of this range against the backdrop of weak real estate statistics in the US will strengthen the chance of a GBP/USD recovery, leading to new purchases and allowing it to reach 1.2495. If there is a breakout above this range, we can expect a surge to 1.2539, where I plan to make a profit. In the scenario of a further decline in GBP/USD and the absence of buyers at 1.2411 in the second half of the day, sellers will have a chance for a more significant drop in the pair. In this case, I will look for purchases around 1.2375. A false breakout will be a suitable option for market entry. I plan to open long positions on GBP/USD immediately on the rebound from 1.2340, targeting a correction of 30-35 points within the day.
To open short positions on GBP/USD:
I believe everyone understands that bears need to assert themselves around the nearest resistance at 1.2465. A false breakout there, along with strong US data, will lead to a good selling point for the pound, continuing the bearish market in anticipation of a decline and a test of support at 1.2411. Please note that the decline from 1.2465 should be quite sharp. If there is no sharp downward movement, the level will most likely be washed out, and the pound will continue to rise. A breakout and a reverse test from bottom to top at 1.2411 will increase pressure on the pair, giving bears an advantage and another entry point for selling with the aim of revisiting 1.2375. The ultimate target will be a minimum of 1.2340, where I will take a profit. In the scenario of GBP/USD rising and the absence of bears at 1.2456 in the second half of the day, bulls will have the opportunity to build a small correction with an upward movement toward the resistance at 1.2495. I will also only consider selling on a false breakout there. If there is no activity there, I suggest opening short positions on GBP/USD from 1.2539, expecting a pair to rebound down by 30-35 points within the day.
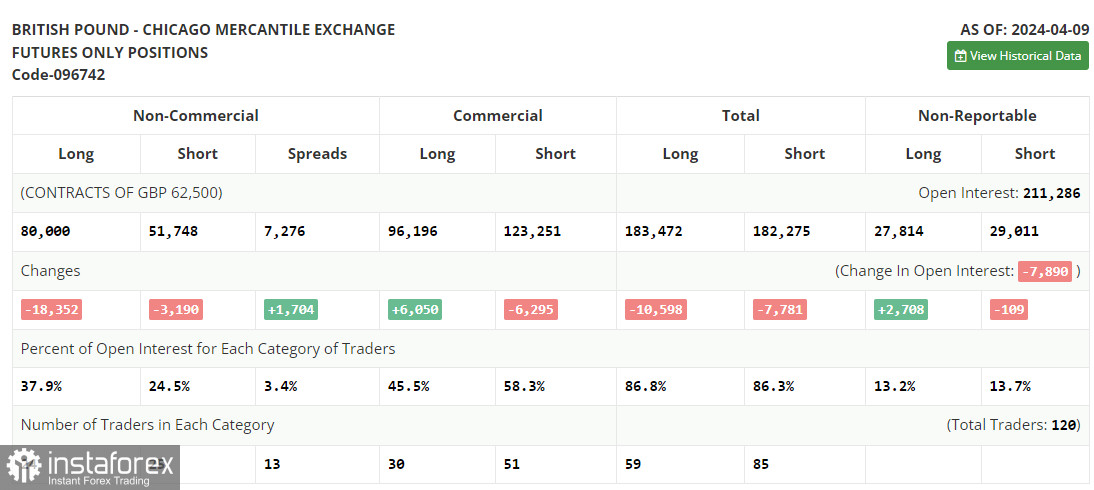
In the COT report (Commitment of Traders) for April 9, there was a sharp reduction in both long and short positions. Pound buyers left the market faster than sellers, and there are objective reasons for this: first, the high inflationary pressure in the US, which will maintain demand for the dollar, putting serious pressure on risky assets, including the British pound. The second reason is the soft policy of the Bank of England, which has yet to go anywhere. New statements from the regulator's representatives may negatively affect the bullish prospects of the pound, especially after the clear position of the ECB last week, which consisted of lowering rates in the eurozone already in early summer this year. In addition to all this, the Federal Reserve needs to maintain a tough stance, and it is unlikely that we can count on a strong bull market in the GBP/USD pair. According to the latest COT report, long non-commercial positions decreased by 18,352 to 80,000, while short non-commercial positions decreased by 3,190 to 51,748. As a result, the spread between long and short positions increased by 1,704.
Indicator signals:
Moving Averages
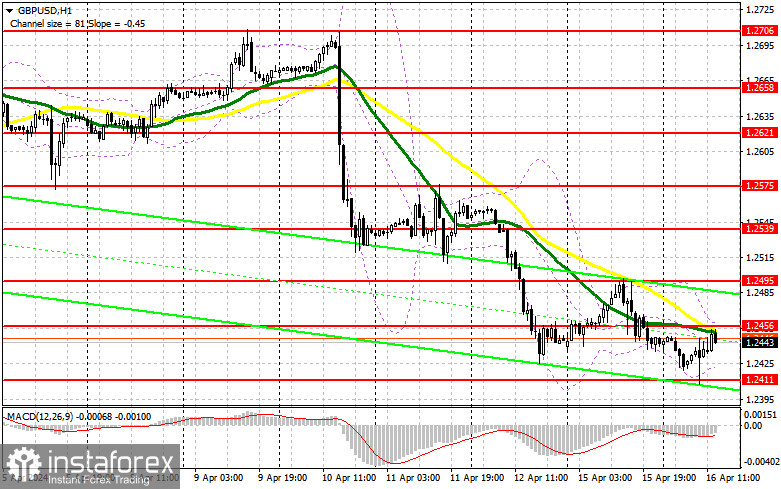
Trading is conducted below the 30 and 50-day moving averages, indicating further pair decline.
Note: The period and prices of moving averages are considered by the author on the hourly chart H1 and differ from the general definition of classical daily moving averages on the daily chart D1.
Bollinger Bands
In the event of a decline, the lower boundary of the indicator will act as support around 1.2420.
Description of Indicators:
• Moving average (MA): Determines the current trend by smoothing volatility and noise. Period 50. Marked in yellow on the chart.
• Moving average (MA): Determines the current trend by smoothing volatility and noise. Period 30. Marked in green on the chart.
• MACD (Moving Average Convergence/Divergence): Fast EMA period 12. Slow EMA period 26. SMA period 9.
• Bollinger Bands: Period 20.
• Non-commercial traders - speculators, such as individual traders, hedge funds, and large institutions, using the futures market for speculative purposes and meeting certain requirements.
• Long non-commercial positions represent the total long open position of non-commercial traders.
• Short non-commercial positions represent the total short open position of non-commercial traders.
• Total non-commercial net position is the difference between short and long positions of non-commercial traders.