 English
  Русский
 Bahasa Indonesia
 Bahasa Malay
 ไทย
ไทย Español
 Deutsch
 Български
 Français
 Tiếng Việt
 中文
中文 বাংলা
বাংলা हिन्दी
 Čeština
 Українська
 Română

Trend analysis:
GBP/USD may start moving upward in April, rising from the closing of the March monthly candle at 1.2622 to the historical resistance level of 1.2848 (blue dashed line). After that, it will climb toward the upper fractal located at 1.3139 (yellow dashed line).
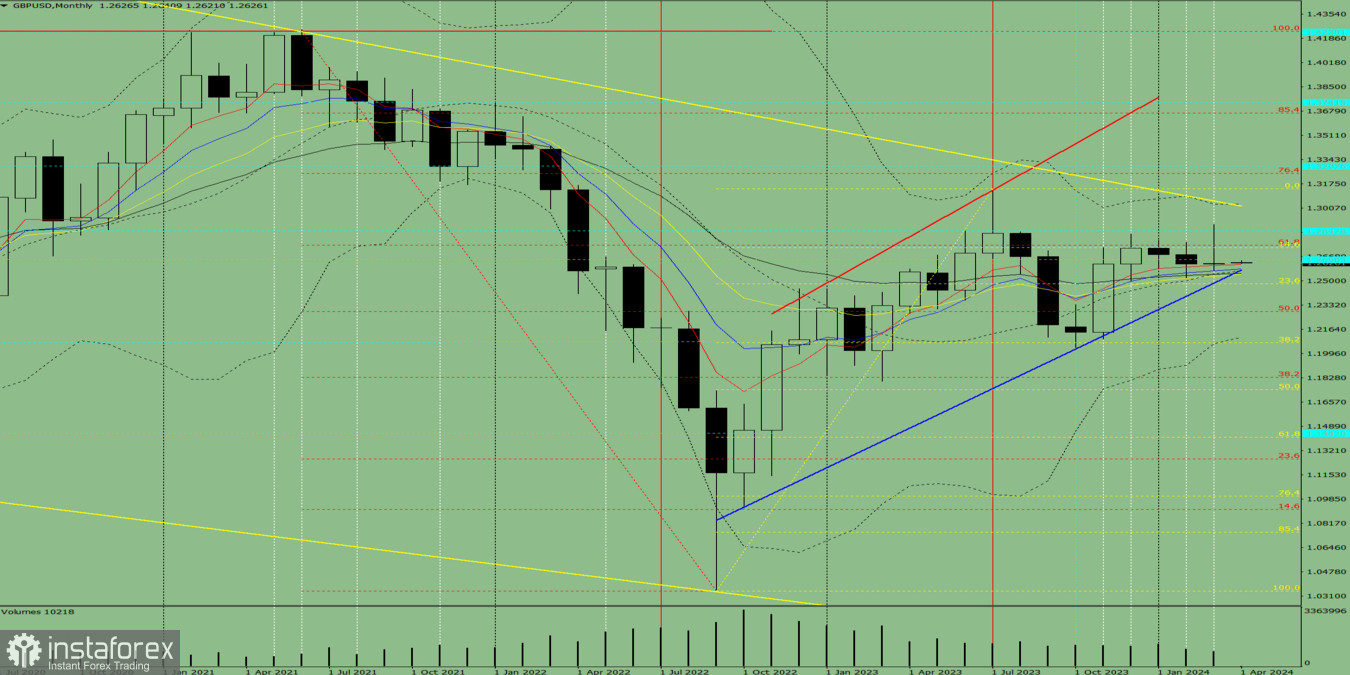
Fig. 1 (monthly chart)
Comprehensive analysis:
Indicator analysis - uptrend
Fibonacci levels - uptrend
Volumes - uptrend
Candlestick analysis - uptrend
Trend analysis - uptrend
Bollinger bands - uptrend
Conclusion: All signals point to an upward movement in GBP/USD.
Overall conclusion: The pair will have a bullish trend, with no first lower shadow on the monthly white candle (first week of month - white) and a second upper shadow (last week of the month - black).
Therefore, for this month, pound will rise from 1.2622 (closing of the March monthly candle) to the historical resistance level of 1.2848 (blue dashed line), and then approach the upper fractal located at 1.3139 (yellow dashed line).
Alternatively, it could go up from 1.2622 (closing of the March monthly candle) to the upper fractal located at 1.2892 (monthly candle from March 2024), followed by a decline to the 14.6% retracement level of 1.2730 (yellow dashed line).