 English
  Русский
 Bahasa Indonesia
 Bahasa Malay
 ไทย
ไทย Español
 Deutsch
 Български
 Français
 Tiếng Việt
 中文
中文 বাংলা
বাংলা हिन्दी
 Čeština
 Українська
 Română

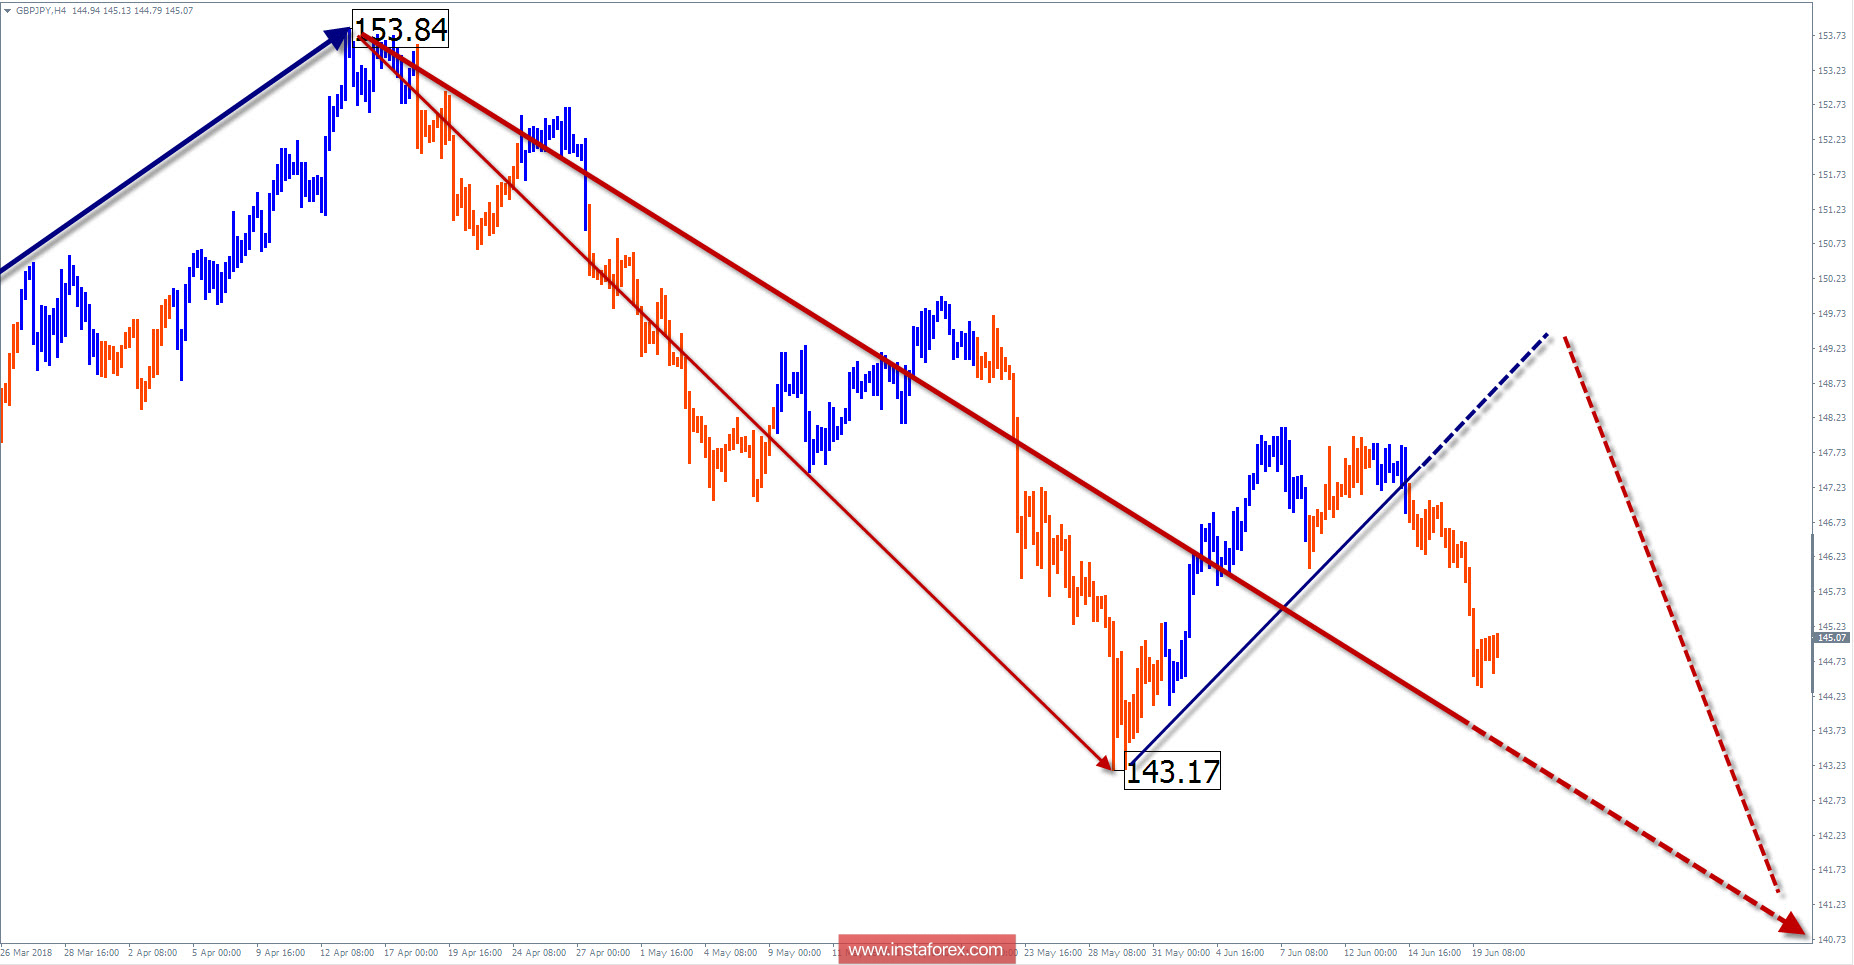
Wave picture of the chart H4:
The main trend of the inter-week trend is the bearish wave of April 13. In a wave of a larger scale, this section completes a descending zigzag.
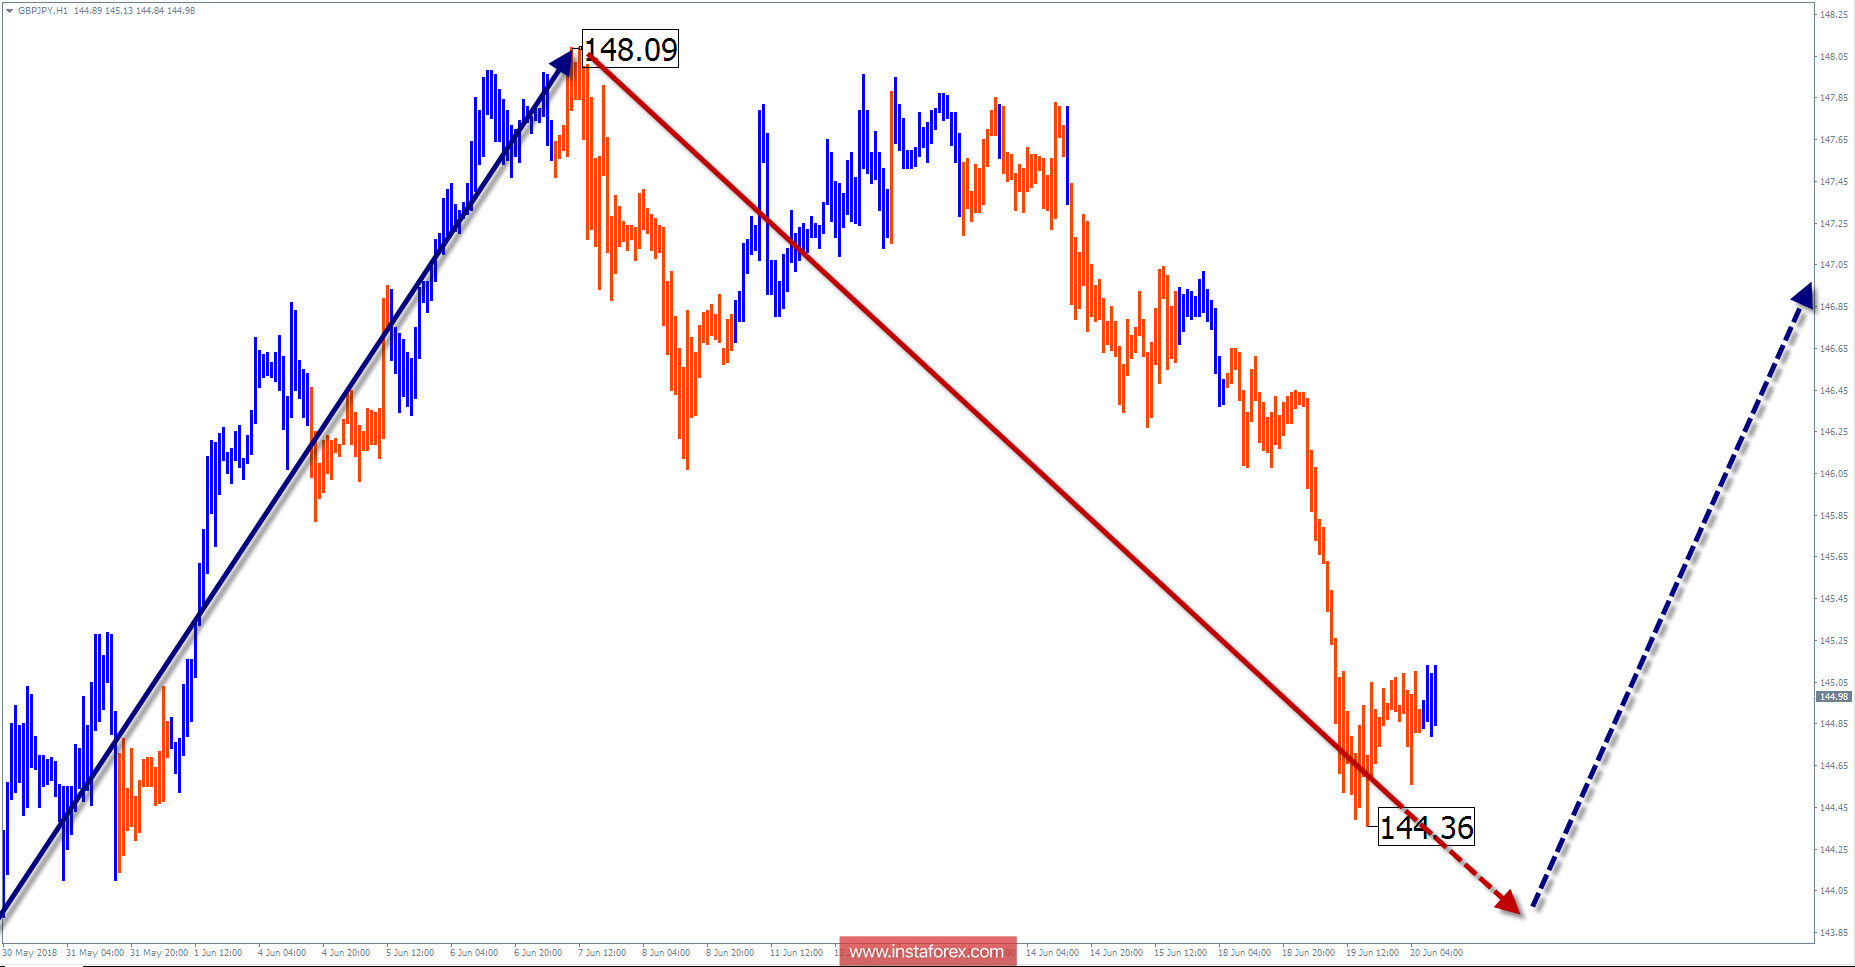
The wave pattern of the graph H1:
The rising wave of May 29 formed the first part (A) of the correction of the previous drop section. Since the beginning of this month, the middle part of the wave (B) is forming.
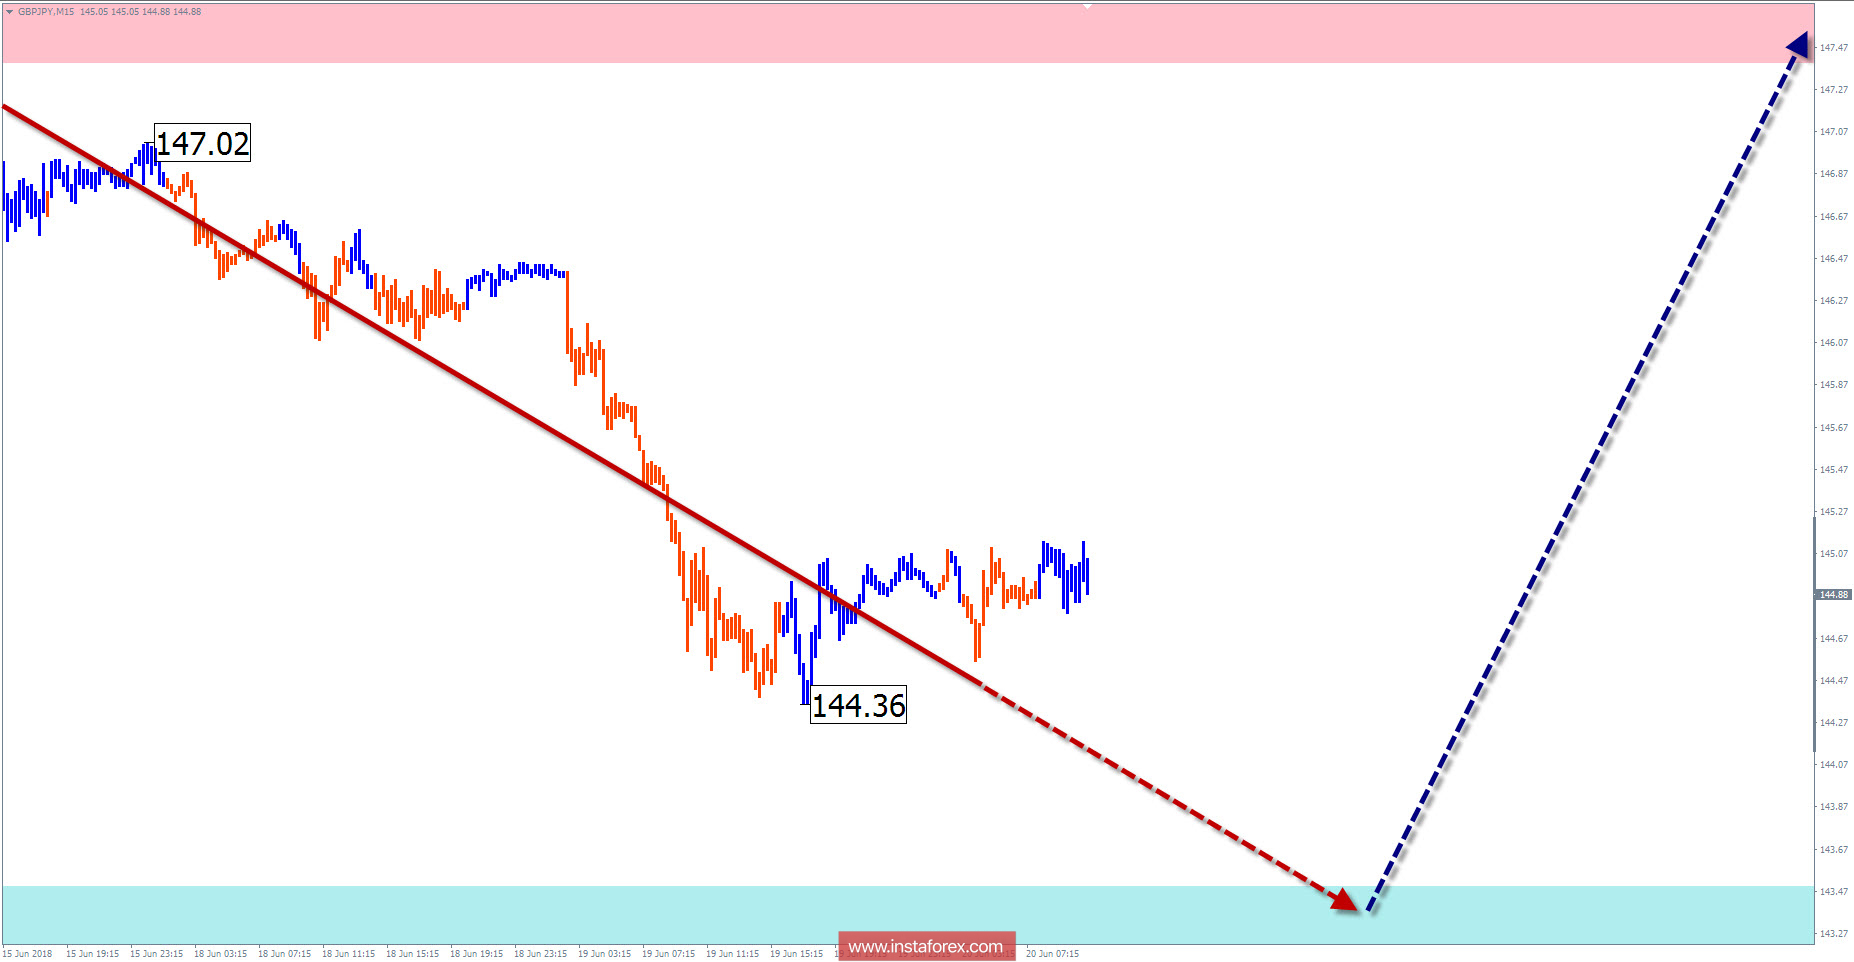
The wave pattern of the M15 chart:
The bearish wave of June 7 is close to completion. Its structure is formed, the target level is within the framework of settlement support.
Recommended trading strategy:
The proponents of inter-day trading can begin to track the signals of buying a pair. There are no signals for trading on larger sections of the chart.
Resistance zones:
- 147.40 / 147.90
Support zones:
- 143.50 / 143.00
Explanations to the figures: In a simplified wave analysis, waves consisting of 3 parts (A-B-C) are used. For analysis, 3 main TFs are used, on each one the last, incomplete wave is analyzed. Zones show the calculated areas with the greatest probability of a turn.
Arrows indicate the wave counting according to the technique used by the author. The solid background shows the generated structure, the dotted - the expected movements.
Attention: The wave algorithm does not take into account the duration of the tool movements in time. To conduct a trade transaction, you need confirmation signals from your trading systems!