 English
  Русский
 Bahasa Indonesia
 Bahasa Malay
 ไทย
ไทย Español
 Deutsch
 Български
 Français
 Tiếng Việt
 中文
中文 বাংলা
বাংলা हिन्दी
 Čeština
 Українська
 Română

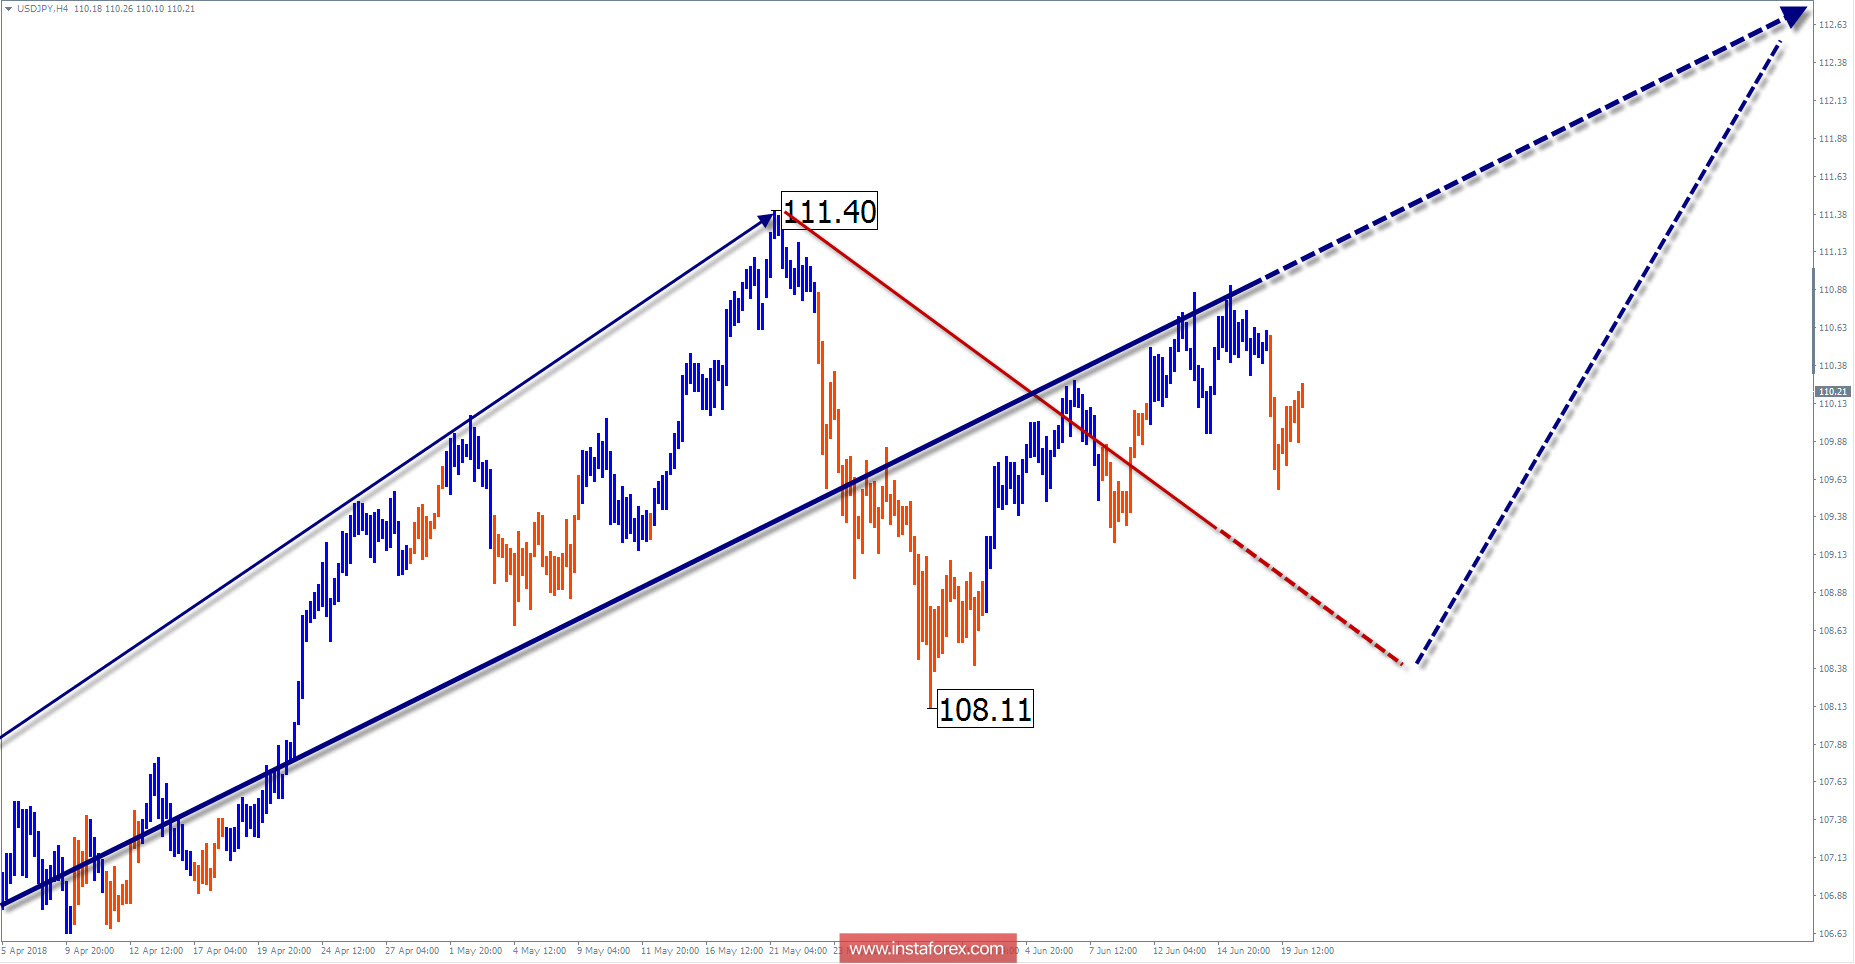
The wave pattern of the H4 graph:
The rising wave of February 16 gave rise to the final part (C) in a larger-scale bullish formation. The preliminary target level is approximately 4 figures higher than the current rate.
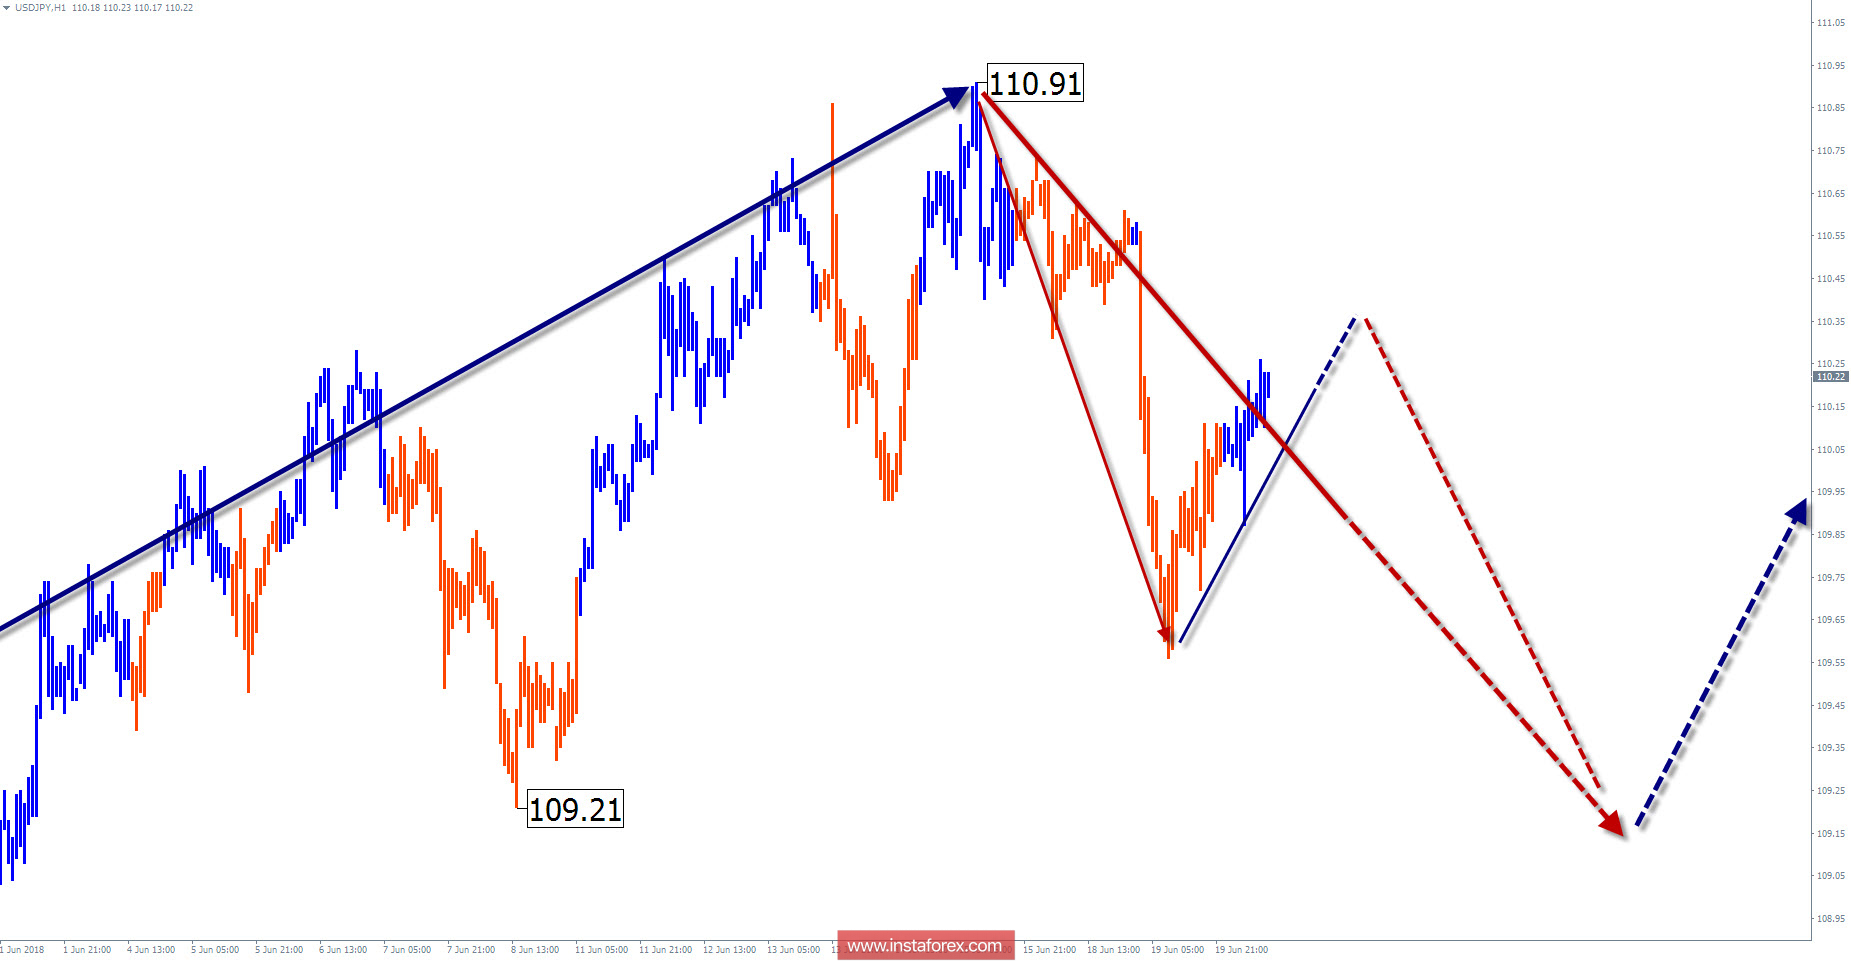
The wave pattern of the H1 graph:
After the corrective phase of the movement, an upward wave formed from May 29. Since last week, the price forms the opposite section (B).
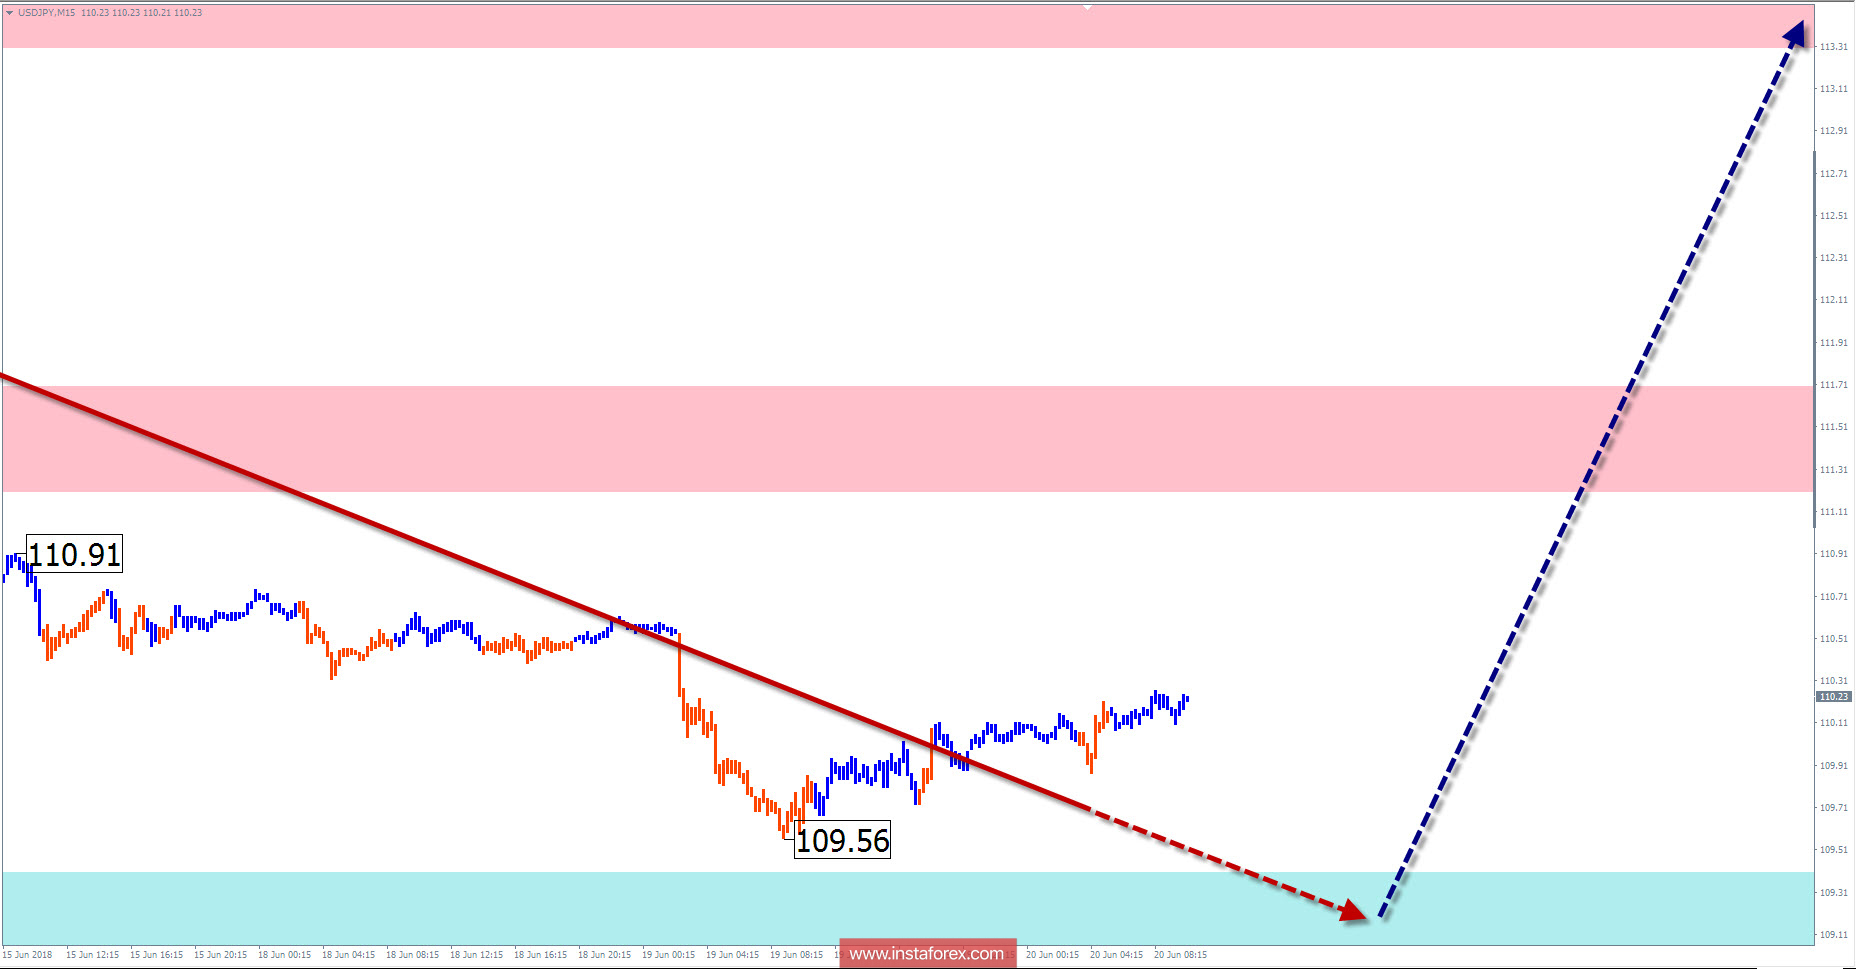
The wave pattern of the M15 chart:
The bearish wave of June 15 takes the place of correction in the previous increase and has a small downward potential.
Recommended trading strategy:
Sales of the instrument are risky and not recommended. For all trading styles, it is recommended to pay attention to buying signals of the pair.
Resistance zones:
- 113.30 / 113.80
- 111.20 / 111.70
Support zones:
- 109.40 / 108.90
Explanations to the figures:
A simplified wave analysis uses a simple waveform, in the form of a 3-part zigzag (ABC). The last incomplete wave for every timeframe is analyzed. Zones show the calculated areas with the greatest probability of a turn.
Arrows indicate the counting of wave according to the technique used by the author. The solid background shows the generated structure and the dotted exhibits the expected wave motion.
Attention: The wave algorithm does not take into account the duration of the tool movements in time. To conduct a trade transaction, you need to confirm the signals used by your trading systems.