 English
  Русский
 Bahasa Indonesia
 Bahasa Malay
 ไทย
ไทย Español
 Deutsch
 Български
 Français
 Tiếng Việt
 中文
中文 বাংলা
বাংলা हिन्दी
 Čeština
 Українська
 Română

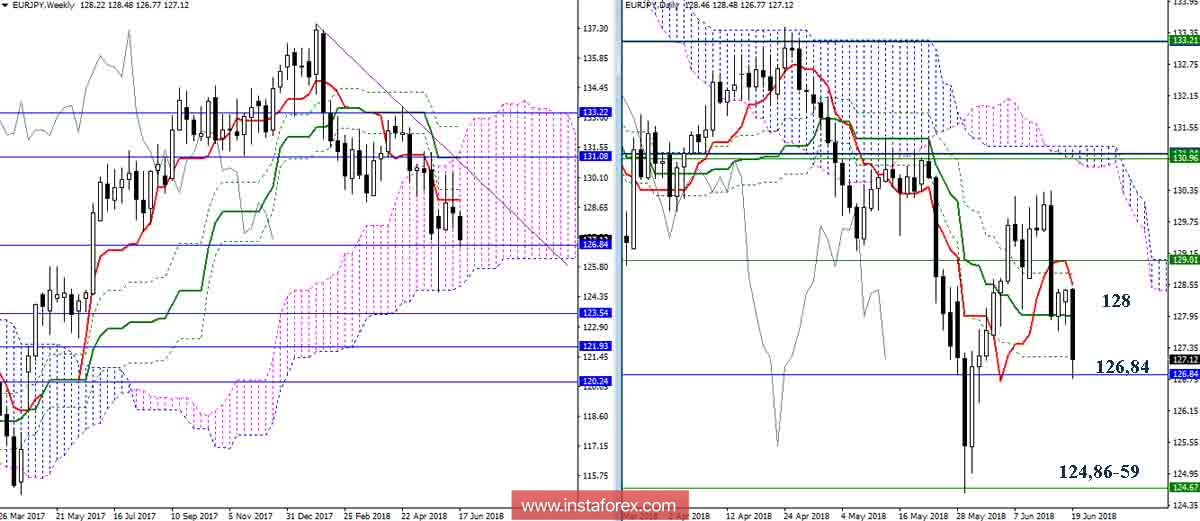
EUR / JPY
The decline was continued and to date, the pair is testing the Fibo Kijun support zone (daily 127.17 + monthly 126.84). Overcoming this support zone opens new prospects for players to lower. The main task will be testing the lower boundary of the weekly cloud (Senkou Span B 124.86) and restoring the downtrend (minimum extremum 124.59).
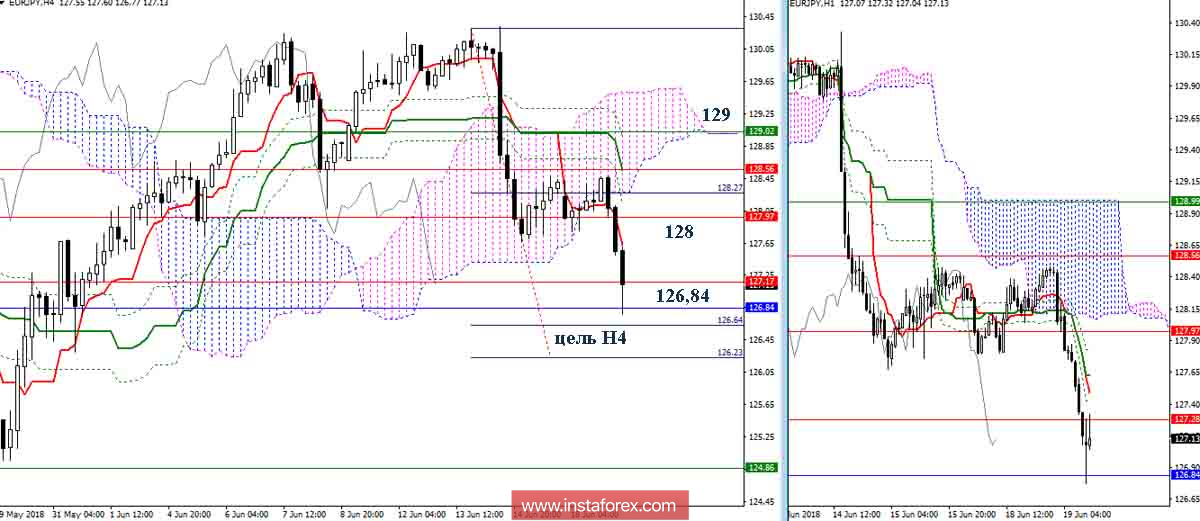
Younger time intervals confirm that a broad enough and strengthened support zone has been met. The support for the higher halves (127.17 - 126.86) + the target for the breakdown of the H4 cloud (126.23-64). As a result, you will need strength and time to overcome this zone. In this situation, the bulls return their positions can change the current balance of power and affect the implementation of bearish plans. The intermediate level of resistance is located today in the area of 128 (cross H1 + cloud H1 + Tenkan N4 + day Kijun), but the most important and significant is the return of line 129.
Indicator parameters:
All time intervals 9 - 26 - 52
The color of indicator lines:
Tenkan (short-term trend) - red,
Kijun (medium-term trend) - green,
Fibo Kijun is a green dotted line,
Chinkou is gray,
Clouds: Senkou Span B (SSB, long-term trend) - blue,
Senkou Span A (SSA) - pink.
The color of additional lines:
Support and resistance MN - blue, W1 - green, D1 - red, H4 - pink, H1 - gray,
Horizontal levels (not Ichimoku) - brown,
Trend lines - purple.