 English
  Русский
 Bahasa Indonesia
 Bahasa Malay
 ไทย
ไทย Español
 Deutsch
 Български
 Français
 Tiếng Việt
 中文
中文 বাংলা
বাংলা हिन्दी
 Čeština
 Українська
 Română

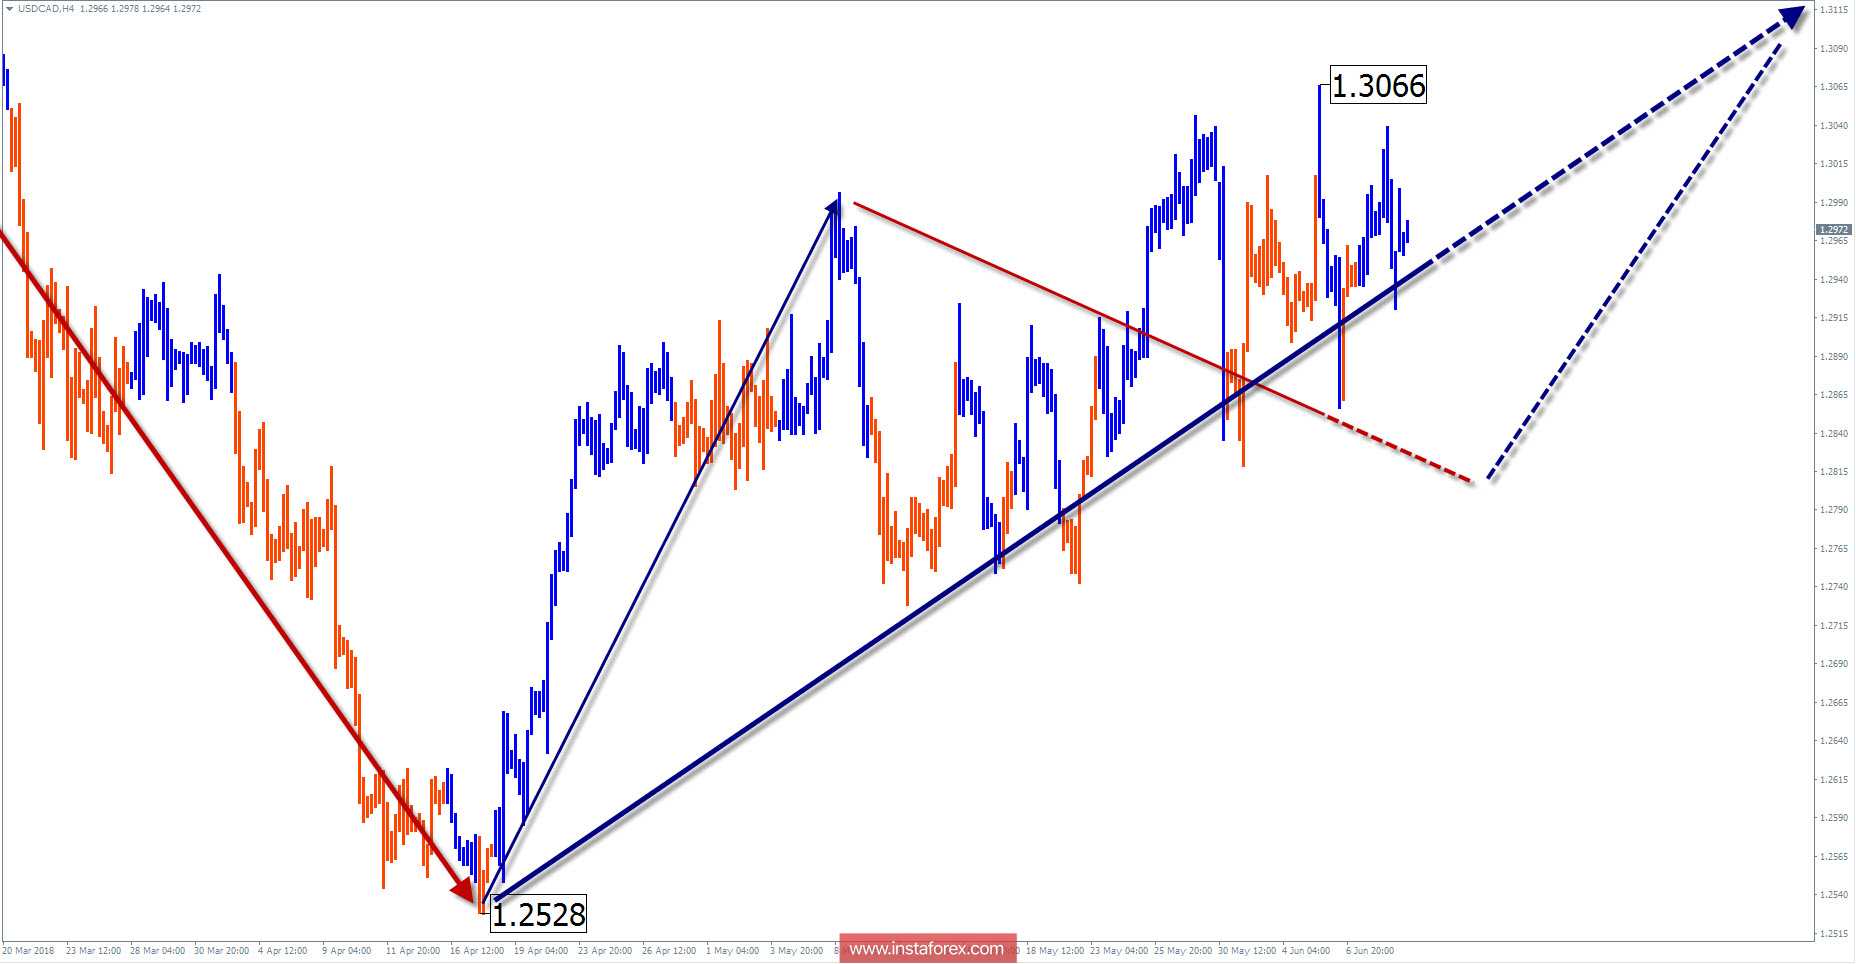
Wave picture of the chart H4:
The wave of the trading instrument that was not completed today started in late January. In a model of a larger scale, it took the place of the final part (C). The lower boundary of the preliminary target zone is approximately in 2 price figures from the current exchange rate of the pair.
The wave pattern of the graph H1:
The direction of short-term trends fits into the algorithm of the rising wave of April 17. An analysis of its structure shows the development of the first 2 parts (AB).
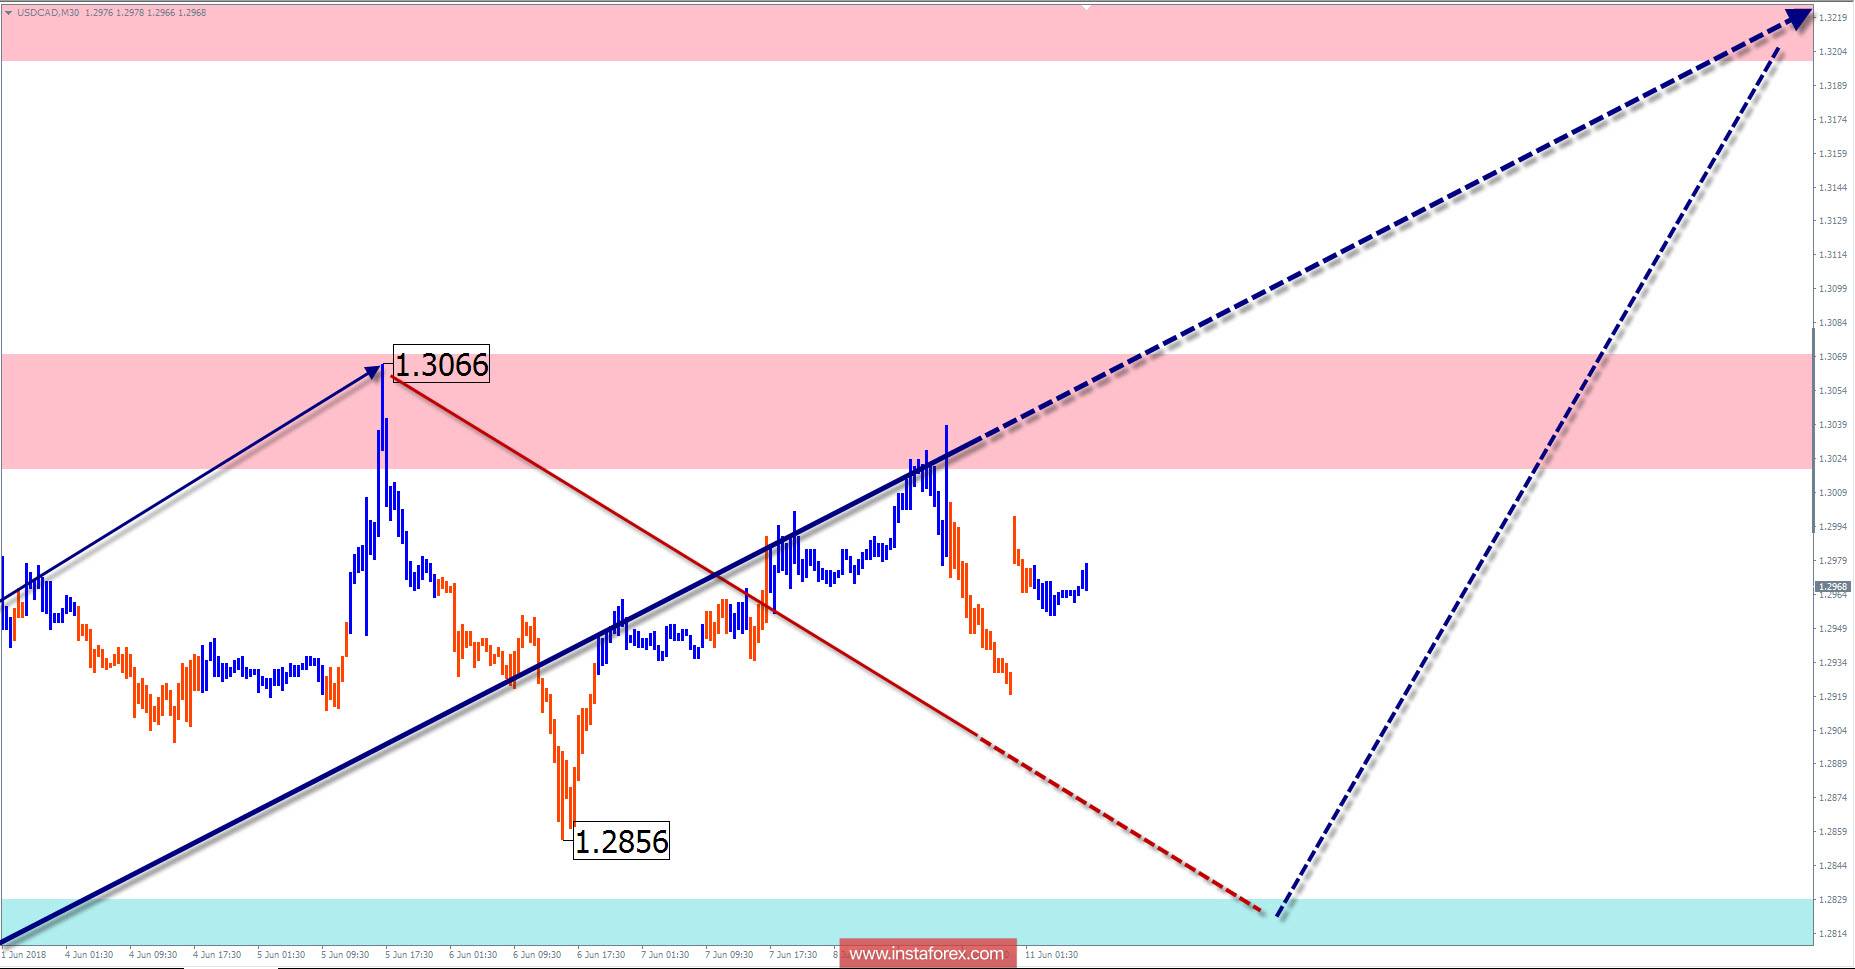
The wave pattern of the M15 chart:
Since may 31, it is possible to track the upward wave structure, in which the middle part (B) is formed in the recent days.
Recommended trading strategy:
Selling will become relevant after the completion of the bullish trend wave. On a weekly scale, traders need to wait for the rollback to end and look for buy signals.
Resistance zones:
- 1.3020/1.3070
- 1.3200/1.3250
Support zones:
- 1.2830/1.2780
Explanations of figures: Simplified wave analysis uses a simple 3-part waveform (A-B-C). At each TF the last incomplete wave is analyzed. Zones show the estimated areas with the greatest probability of a turn.
Arrows indicate the wave counting according to the technique used by the author. The solid background shows the generated structure, dotted - the expected wave motion.
Attention: The wave algorithm does not take into account the duration of the tool movements in time. To conduct a trade transaction, you need confirmation signals from your trading systems!