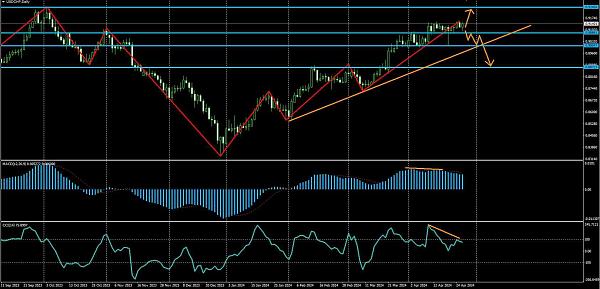
Chart D1 USDCHF pair. The wave structure here is still constructed in an ascending order, and the MACD indicator is in the overbought zone. However, the indicator has started to decline below its signal line, indicating buyer weakness. For over two weeks, the price has been above the horizontal support level of 0.9084 and has been unable to further develop growth from this point. It seems like it could rise to the level of 0.9240, as it is attempting to do so, but faces strong selling pressure from above. Sellers see a strong signal for a decrease on the same MACD indicator - bearish divergence. It is also present on the second indicator used, CCI, although not as clear, as the price has slightly moved up while being in a sideways position, forming a divergence as well. Judging by the inability to develop growth from the level and the time the price has spent near it, I assume it will be broken downwards. Although selling is risky until the level is breached, contrary to the forecast, growth could still occur, especially if the EURUSD pair, the USDCHF's opponent, starts to fall, which it began to do on Friday from the daily resistance level. It's a confusing situation, I would wait for now and consider entering a short position if a candle closes below 0.9084, as it would confirm the divergence signal and increase the likelihood of its realization. I assume that if this signal plays out, the price could drop to around the level of 0.8872. I am hesitant to buy here precisely because of these divergences, as the probability of a decline against them decreases, and I need a higher probability of a positive outcome.
*Die zur Verfügung gestellte Marktanalyse dient zu den Informationszwecken und sollte als Anforderung zur Eröffnung einer Transaktion nicht ausgelegt werden
 Deutsch
  Русский
 English
 Bahasa Indonesia
 Bahasa Malay
 ไทย
ไทย Español
 Български
 Français
 Tiếng Việt
 中文
中文 বাংলা
বাংলা हिन्दी
 Čeština
 Українська
 Română
Comments: