Deutsch
  Русский
 English
 Bahasa Indonesia
 Bahasa Malay
 ไทย
ไทย Español
 Български
 Français
 Tiếng Việt
 中文
中文 বাংলা
বাংলা हिन्दी
 Čeština
 Українська
 Română
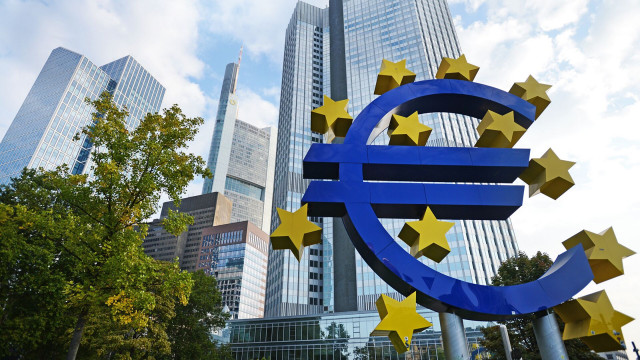
FX.co ★ Tägliche Forex-Analysen. Prognose des heutigen Wechselkurses

Forex-Analysen
Wenn Sie Erfolg beim Trading erzielen möchten, sind die hochwertigen analytischen Informationen für Sie notwendig. Wie die Praxis zeigt kann leider nicht jeder Trader die Situation auf dem Finanzmarkt selbständig analysieren. Der Abschnitt "Forex-Analysen" enthält Artikel von Experten, die Analysen verschiedener Ereignisse in der Finanzwelt durchführen und über langjährige Erfahrung im Forex-Handel dabei verfügen. Hier werden regelmäßig tägliche analytische Übersichten und Prognosen veröffentlicht, damit Sie ausreichende Informationen haben, um Handelsentscheidungen zu treffen.
Autor:
Alle
Chin Zhao
Miroslaw Bawulski
Paolo Greco
Daichi Takahashi
Arief Makmur
Mohamed Samy
Ratu Taslim
Mourad El Keddani
Laurie Bailey
Samir Klishi
Stefan Doll
Evangelos Poulakis
Torben Melsted
Samanta Kruder
Isabel Clark
Petar Jacimovic
Alexandros Yfantis
Sebastian Seliga
Gven Podolsky
Mark Bom
Jakub Novak
Pati Gani
Irina Manzenko
Ekaterina Smirnova
Larisa Kolesnikova
Svetlana Doronina
Anna Zotova
Igor Belozerov
Viktor Isakov
Tatiana Strelkova
Roman Agafonov
Ralph Shedler
Oscar Ton
Jozef Kovach
Daniel Liderman
Anastasia Miller
Alexandr Kuleshov
Oleg Stolny
Jurij Tolin
Nina Kromchenko
Svetlana Radchenko
Georgy Kesov
Irina Yanina
Egor Danilov
Аlena Ivannitskaya
Roman Onegin
Vitaly Kolesnikov
Ekaterina Kiseleva
Maxim Petrov
Artem Petrenko
Dimitrios Zappas
Irina Maksimova
Natalia Andreeva
Tatiana Kravchenko
Jan Novotny
Kate Smirnova
Thomas Frank
Maria Shablon
Andrey Shevchenko
Tim Clayton
Daniel Adler
Kuvat Raharjo
Dean Leo
Marek Petkovich
Kategorie:
Alle
Fundamental analysis
Fractal analysis
Wave analysis
Technical analysis
Review
Forecast
Stock Markets
Candlestick analysis
Ichimoku Indicator
Hot forecast
Trading plan
Crypto-currencies
Analytical News
Trend Line
Tags:
Alle
AUD
AUDCAD
AUDCHF
AUDCZK
AUDDKK
AUDHKD
AUDHUF
AUDJPY
AUDMXN
AUDNOK
AUDNZD
AUDPLN
AUDSEK
AUDSGD
AUDUSD
AUDZAR
CAD
CADCHF
CADCZK
CADDKK
CADHKD
CADHUF
CADJPY
CADMXN
CADNOK
CADPLN
CADSEK
CADZAR
CHF
CHFCZK
CHFDKK
CHFHKD
CHFHUF
CHFJPY
CHFMXN
CHFNOK
CHFPLN
CHFSEK
CHFSGD
CHFZAR
CNY
CNYUSD
CZKJPY
DKKJPY
EUR
EURAUD
EURCAD
EURCHF
EURCZK
EURDKK
EURGBP
EURHKD
EURHUF
EURJPY
EURMXN
EURNOK
EURNZD
EURPLN
EURRUR
EURSEK
EURSGD
EURUSD
EURZAR
GBP
GBPAUD
GBPCAD
GBPCHF
GBPCZK
GBPDKK
GBPHKD
GBPHUF
GBPJPY
GBPMXN
GBPNOK
GBPNZD
GBPPLN
GBPSEK
GBPSGD
GBPUSD
GBPZAR
HKDJPY
HUFJPY
JPY
MXNJPY
NOKJPY
NZD
NZDCAD
NZDCHF
NZDCZK
NZDDKK
NZDHKD
NZDHUF
NZDJPY
NZDMXN
NZDNOK
NZDPLN
NZDSEK
NZDSGD
NZDUSD
NZDZAR
RUB
SEKJPY
SGDJPY
USD
USDCAD
USDCHF
USDCNY
USDCZK
USDDKK
USDHUF
USDIDR
USDINR
USDJPY
USDMXN
USDNOK
USDPLN
USDRUB
USDRUR
USDSEK
USDSGD
USDZAR
ZARJPY
Bitcoin
Bitcoin Cash
Cardano
Chainlink
Crypto industry news
Doge
Ethereum
Filecoin
ICO
Litecoin
Mining
Polkadot
Ripple
Satoshi Nakamoto
Smart contract
Trading
Uniswap
#AA
#AABA
#AAPL
#ABT
#ADBE
#AFLT
#AIG
#AMD
#AMZN
#AXP
#BA
#BAC
#BHP
#BIDU
#BK
#C
#CAT
#CHL
#CHMF
#CL
#CMCSA
#CSCO
#CVX
#DAX
#DIS
#DWDP
#EBAY
#F
#FB
#FCX
#FDX
#FEES
#FSLR
#FTSE
#GAZP
#GE
#GILD
#GOOG
#GS
#HAL
#HD
#HON
#HPQ
#HSI
#HYDR
#IBM
#ILMN
#INDU
#INTC
#IP
#JCP
#JNJ
#JPM
#KHC
#KO
#LKOH
#MA
#MCD
#MDLZ
#MGM
#MICEX
#MMM
#MO
#MON
#MRK
#MRVL
#MS
#MSFT
#MSNG
#MTLR
#MTSS
#MU
#N225
#NDX
#NFLX
#NG
#NKE
#NOK
#NTDOY
#NVTK
#ORAN
#ORCL
#OZON
#PAF
#PBR
#PEP
#PFE
#PG
#PLF
#PLZL
#QCOM
#QQQ
#RASP
#ROSN
#RSTI
#RTKM
#S
#SBER
#SBUX
#SNE
#SPX
#SPY
#T
#TATN
#TEVA
#TRI
#TRNFP
#TRV
#TSLA
#TWTR
#UBS
#UL
#UPS
#USDX
#UTX
#V
#VTBR
#VZ
#WDC
#WFC
#WMT
#XOM
#ZNGA
American markets
Asian markets
European markets
Russian markets
Commodity
Gas
Gold
Oil
Silver
COT (Commitment of Traders)
COVID-19
Für Anfänger
sortieren:
nach Zeit der Veröffentlichung
nach Zeit der Veröffentlichung
nach Beliebtheit