 中文
中文  Русский
 English
 Bahasa Indonesia
 Bahasa Malay
 ไทย
ไทย Español
 Deutsch
 Български
 Français
 Tiếng Việt
 বাংলা
বাংলা हिन्दी
 Čeština
 Українська
 Română
FX.co ★ 外汇交易者门户
Top News
Most Read
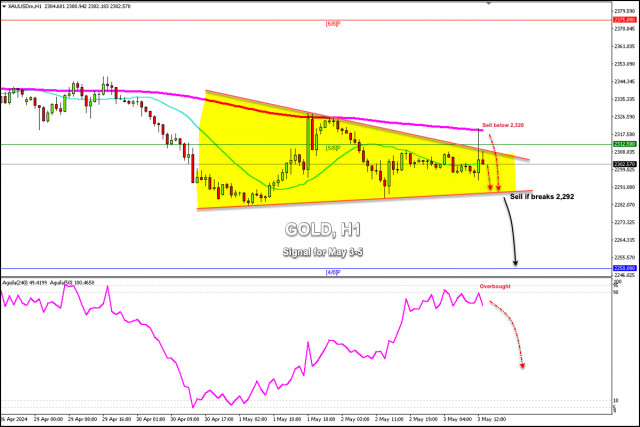
2024年5月3日至5日黃金交易信號:在$2,320以下或在$2,300以下賣出(21日SMA - 200日EMA)
黃金價位在 2,302.57 左右交易,美國交易時段觸及 2,320 高點後出現回落。這個區域代表著 200 日均線並證明是黃金的強勢頂部。......
 关联到2024-05-17
分析专家:
2024-05-03T14:46:35
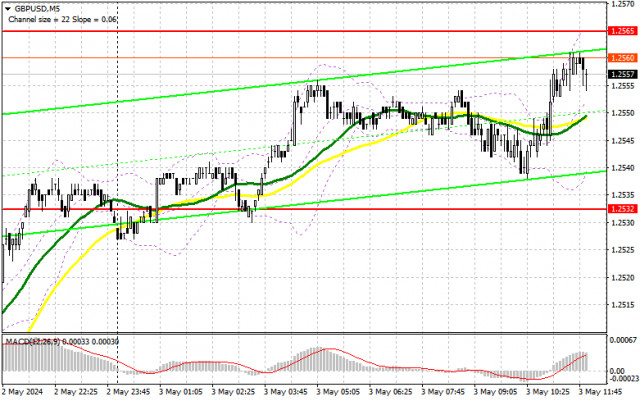
GBP/USD:5月3日美國交易時段的交易計劃(對早盤交易的分析)。英鎊準備突破偏盤通道。
在我的早間預測中,我專注於1.2565的水平,計劃基於此做出市場進入的決策。現在讓我們來看看5分鐘圖表,分析那裡發生了什麼。......
关联到2024-05-04分析专家:
2024-05-03T11:16:12
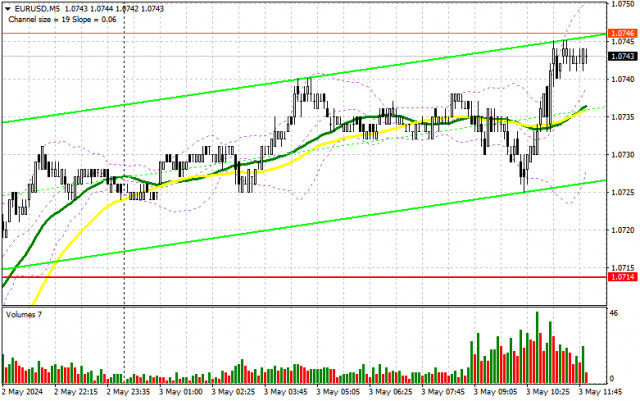
EUR/USD:5月3日美國盤交易計畫(早盤交易分析)。美國數據將是本週的關鍵時刻。
在我的早间预测中,我着重关注了1.0751水平,并计划根据它来做出市场进入的决定。让我们看一下5分钟图表,分析那里发生了什么。......
关联到2024-05-04分析专家:
2024-05-03T10:40:47
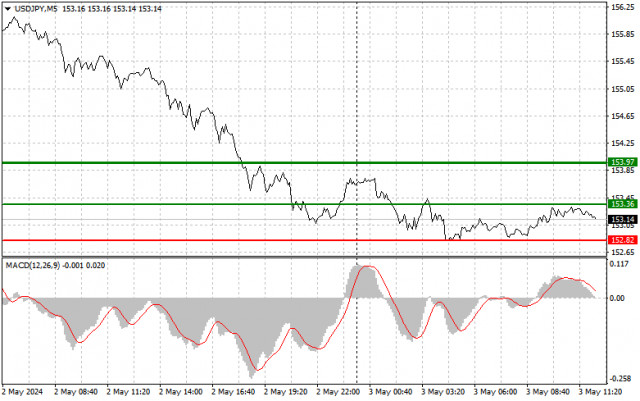
USD/JPY:5月3日(美國時段)初學者的簡單交易技巧
貿易分析與交易日元的建議 由於低波動性,今天上午我指出的水平測試並沒有發生,這是昨天美元大幅抛售之前顯著的事件。下午將取決於美國的報告。......
关联到2024-05-04分析专家:
2024-05-03T10:28:46
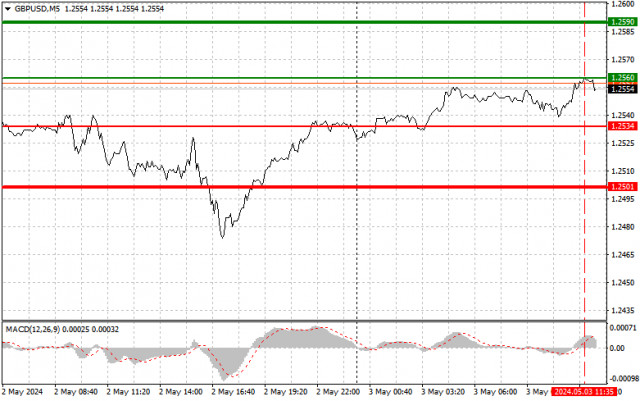
GBP/USD:5月3日(美國盤)新手交易者的簡單交易提示
貿易分析和有關英鎊交易的建議 在當天上半場價格測試1.2560時,MACD指標顯著飆升到零線以上,限制了該貨幣對進一步上漲的潛力,尤其是在重要的美國統計數據公布之前。因此,我沒有購買。......
关联到2024-05-04分析专家:
2024-05-03T10:14:02

2024年5月3日的视频市场更新
美元指數可能會上漲......
关联到2024-05-04分析专家:
2024-05-03T10:12:50
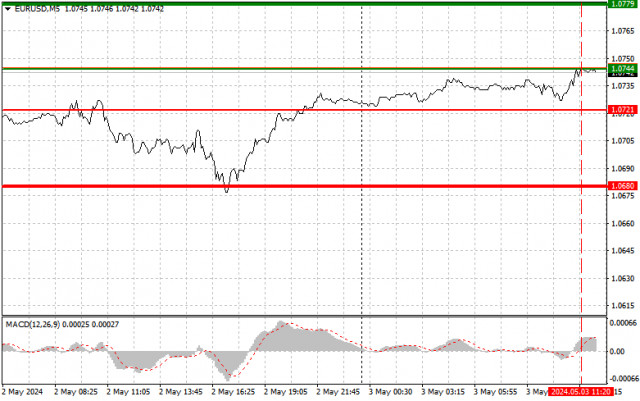
EUR/USD:5月3日(美國盤中)初學者交易者的簡單交易提示
貿易分析和交易歐洲貨幣 在當天上半場價格測試到1.0744的時刻,MACD指標急劇上升超過零點,限制了該貨幣對的進一步上升潛力,尤其是在重要的美國統計數據發布之前。因此,我沒有購買。......
关联到2024-05-04分析专家:
2024-05-03T10:05:12
歐元不懂聯邦儲備系統的信號
美聯儲決定保持耐心。聯儲主席鮑威爾對此表示非常清楚。......
关联到2024-05-07分析专家:
2024-05-02T22:53:03
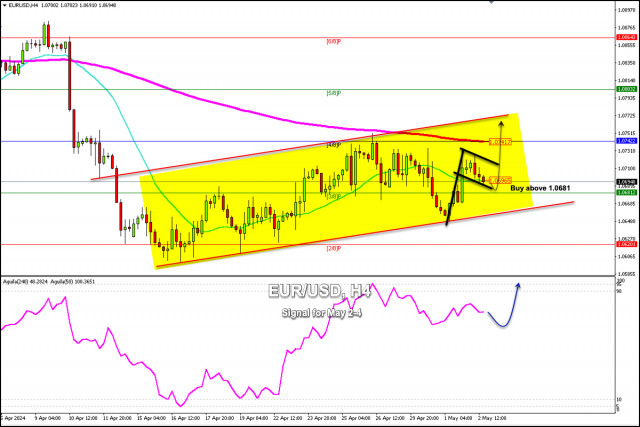
2024年5月2日至4日EUR/USD交易信號:在1.0681(21 SMA - 3/8 Murray)以上買入
歐元一直在1.0694左右波動,高於21日簡單移動平均線,並在自4月15日形成的上升通道內部交易。EUR/USD交易對正在形成一個看漲旗型圖案,因此該工具可能會恢復其看漲週期。......
关联到2024-05-07分析专家:
2024-05-02T15:43:30
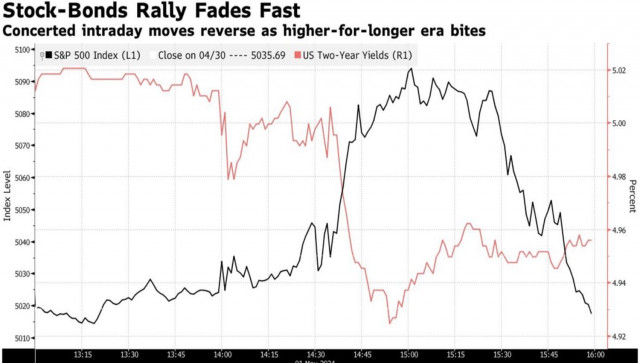
美元在X日经历了波动
預期的非農就業人數數據可能顯示美國經濟上月新增了 243k 個新職位。這個數字明顯低於 3 月新增的 303k 個就業崗位,可能表明就業增長放緩。......
关联到2024-05-04分析专家:
2024-05-03T13:20:30
显示更多
Upload more