 বাংলা
বাংলা  Русский
 English
 Bahasa Indonesia
 Bahasa Malay
 ไทย
ไทย Español
 Deutsch
 Български
 Français
 Tiếng Việt
 中文
中文 हिन्दी
 Čeština
 Українська
 Română
Earlier the Global Financial Integrity company calculated that in the period from 1994 to 2011, the illegal flow of money to the Russian Federation and the same withdrawal of funds were $1.3 trillion. The Central Bank indicators were not included in the GFI calculation.
It is known that the report with detailed data on each of the developing countries, where illegal money flow prospers, is publicly presented by GFI in Washington.

Unfortunately, Russia turned out to be on the first place of the ranking. According to the GFI data, in the period from 1994 to 2012, the illegal withdrawal of funds from the RF has stopped at $1 trillion 341.3 billion (8.3% of GDP), and the illegal flow of capital into the country amounted to $1 trillion 925.4 billion (12% of GDP).
Analysts specify that when conducting relevant operations document forgery was most often used in the country. For example, an inappropriate amount of goods sold abroad was reported, and the balances from such transactions were placed in foreign banks' accounts.

Mexica turned out to be on the second place of the list. However, the state has received the illegal capital inflow equal to $1 trillion 156.9 billion (4.5% of GDP) not for 15 years, this amount has accumulated for 40 years. Over the same period, the illegal outflow of money from Mexico was $1.507 billion (4.1% of GDP).
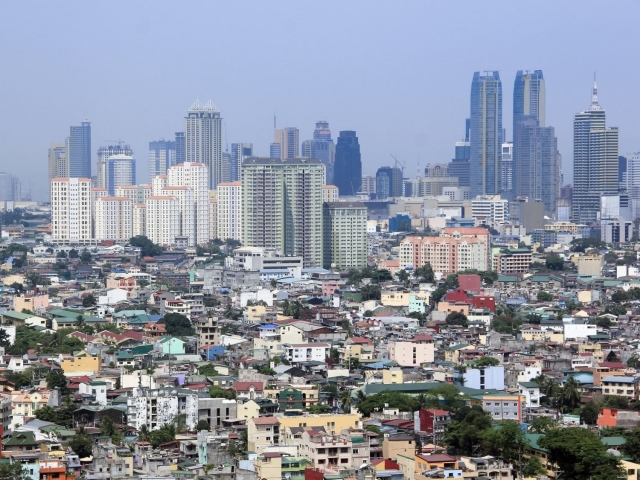
The Philippines closes the top three. Analysts from GFI estimated that in the decade to 2012 the state lost about $9.3 billion every year. It is noted that the most popular ways to carry out illegal scheme with capital are leakages from balance of payments and forgery of foreign trade transactions. During the period from 1960 to 2012, the amount of illegal capital flow to the Philippines was $415.781 billion (7.4% of GDP), the amount of outflow was $222.624 billion (4.5% of GDP).
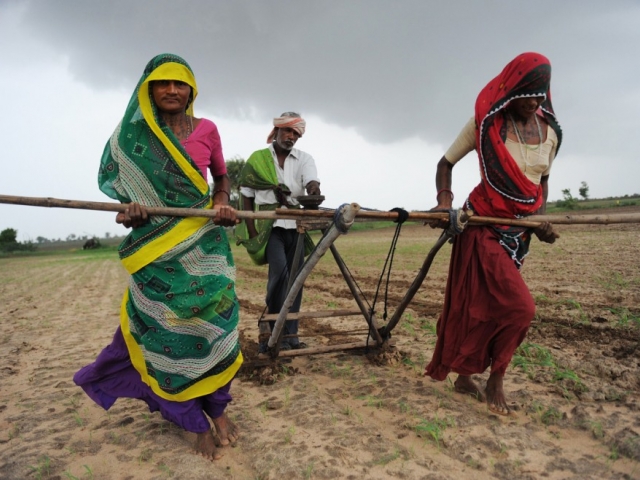
India takes the fourth line of the ranking from the Global Financial Integrity. The company's analysts estimated that in the period from 1948 to 2012 the illegal outflow of capital in the state was equal to $682.2 billion (1.5% of GDP). The capital inflow stopped at $842.9 billion (1.8% of GDP). The GFI study reports that the main element promoting illegal capital flow to the country is corruption. It is believed that as a whole, it is not easy to estimate the exact figures of illicit capital flows in India.
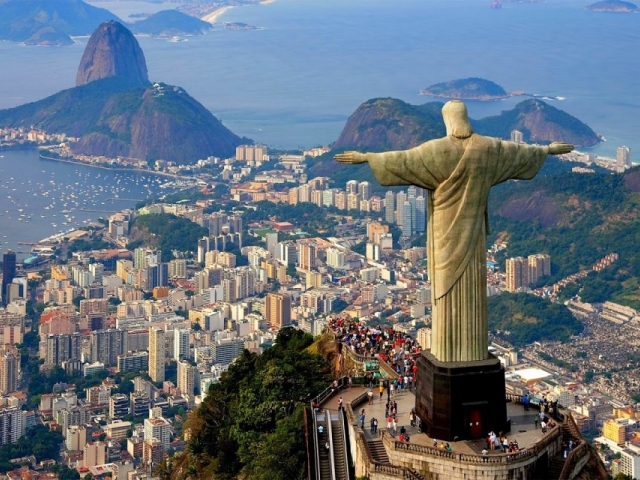
Brazil closes the top five of the states. In the period from 1960 to 2012 the illicit capital outflow demonstrated the figure of $561.7 billion (1.6% of GDP), inflow - $520.3 billion (1.1% of GDP). It is noted that for the last 50 years the state's economy has come to liberalization that made the capital outflow, previously considered illegal due to strict currency control, legal. It is also explained that illegal inflow of money is connected with macroeconomic indicators: the level rises sharply during the crisis and systematically declines after it.