 English
  Русский
 Bahasa Indonesia
 Bahasa Malay
 ไทย
ไทย Español
 Deutsch
 Български
 Français
 Tiếng Việt
 中文
中文 বাংলা
বাংলা हिन्दी
 Čeština
 Українська
 Română

GBP/USD remains hovering around the 200 SMA area at H1 chart, with another attempt to break higher in order to extend the rally towards the next key resistance level of 1.2826. If the pair manages to break below 1.2710, then we can expect further weakness towards the support level of 1.2652. MACD indicator is still at the negative territory, favoring the bearish bias.
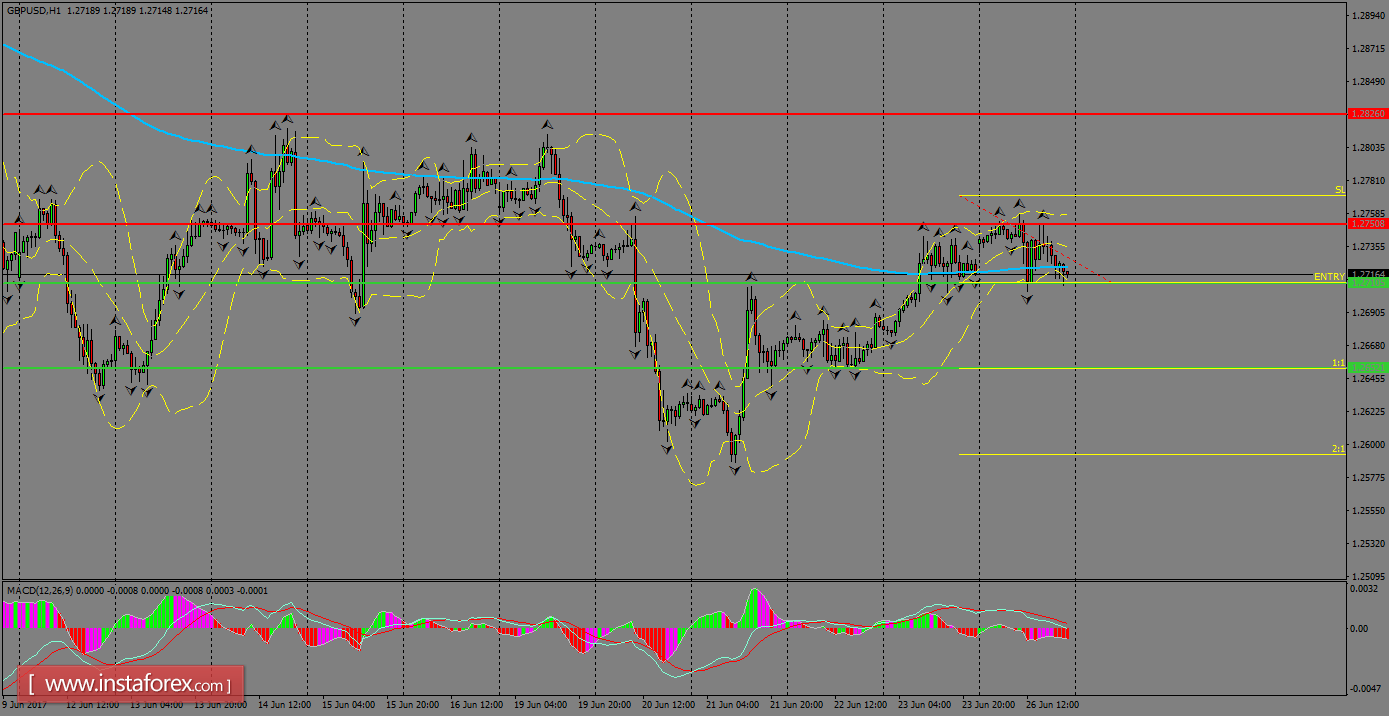
H1 chart's resistance levels: 1.2750 / 1.2826
H1 chart's support levels: 1.2710 / 1.2652
Trading recommendations for today: Based on the H1 chart, sell (short) orders only if the GBP/USD pair breaks a bearish candlestick; the support level is at 1.2710, take profit is at 1.2652 and stop loss is at 1.2770.