 English
  Русский
 Bahasa Indonesia
 Bahasa Malay
 ไทย
ไทย Español
 Deutsch
 Български
 Français
 Tiếng Việt
 中文
中文 বাংলা
বাংলা हिन्दी
 Čeština
 Українська
 Română

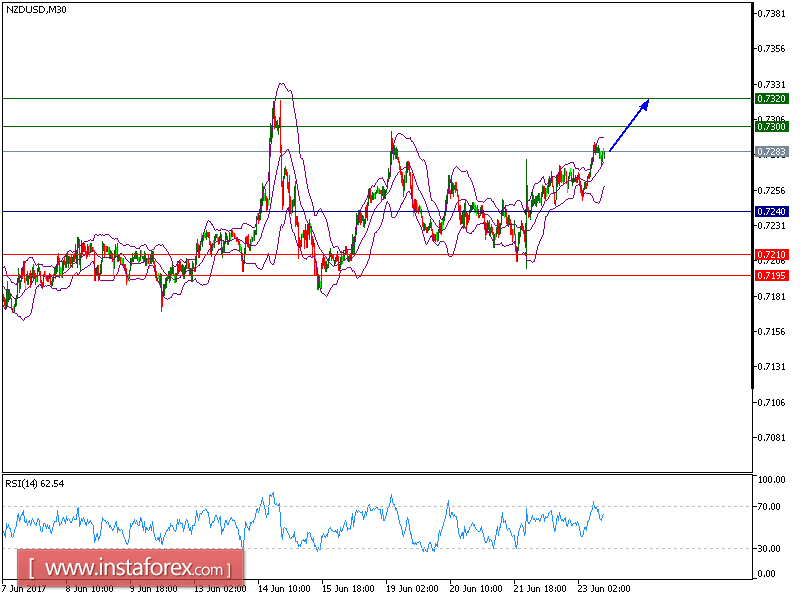
We will retain our NZD/USD Yesterday's target, pair moved upward and we are looking for the upside target of 0.73. The pair is trading above the rising 50-period moving average, which plays a support role. The relative strength index stands firmly above its neutrality level at 50. The downside potential should be limited by the key support at 0.7240.
Hence, as long as this key level is not broken, a further rebound to 0.7300 and even to 0.7350 seems more likely to occur.
Strategy: BUY Stop Loss: 0.7240. Take Profit: 0.7300
Chart Explanation: The black line shows the pivot point. Currently, the price is above the pivot point which indicates the bullish position. If it is below the pivot points, it indicates the short position. The red lines show the support levels and the green line indicates the resistance levels. These levels can be used to enter and exit trades.
Resistance levels: 0.7300, 0.7320, and 0.7355
Support levels: 0.7210, 0.7195, and 0.7160