 English
  Русский
 Bahasa Indonesia
 Bahasa Malay
 ไทย
ไทย Español
 Deutsch
 Български
 Français
 Tiếng Việt
 中文
中文 বাংলা
বাংলা हिन्दी
 Čeština
 Українська
 Română

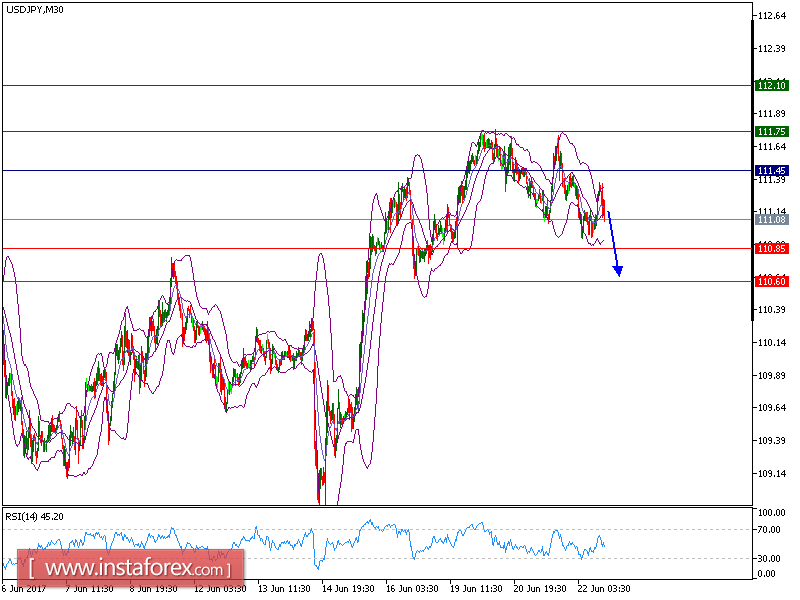
USD/JPY target which was predicted in previous analysis has been hit. The pair retreated from 111.75 (highs of June 20 and 21) and broke below the 20-period moving average. The relative strength index is below its neutrality level at 50.
Hence, as long as 111.45 holds on the upside, look for a return to 110.85. A break below this level would trigger a new decline to 110.60.
Alternatively, if the price moves in the opposite direction as predicted, a long position is recommended above 111.45 with targets at 111.75 and 112.10.
Chart Explanation: The black line shows the pivot point. The present price above pivot point indicates the bullish position while the price below pivot points indicates the short position. The red lines show the support levels and the green line indicates the resistance levels. These levels can be used to enter and exit trades.
Strategy : BUY, Stop Loss: 111.15, Take Profit: 112.10
Resistance levels: 111.75, 112.10, and 112.50
Support levels: 110.85,110.60, and 110.35