 English
  Русский
 Bahasa Indonesia
 Bahasa Malay
 ไทย
ไทย Español
 Deutsch
 Български
 Français
 Tiếng Việt
 中文
中文 বাংলা
বাংলা हिन्दी
 Čeština
 Українська
 Română

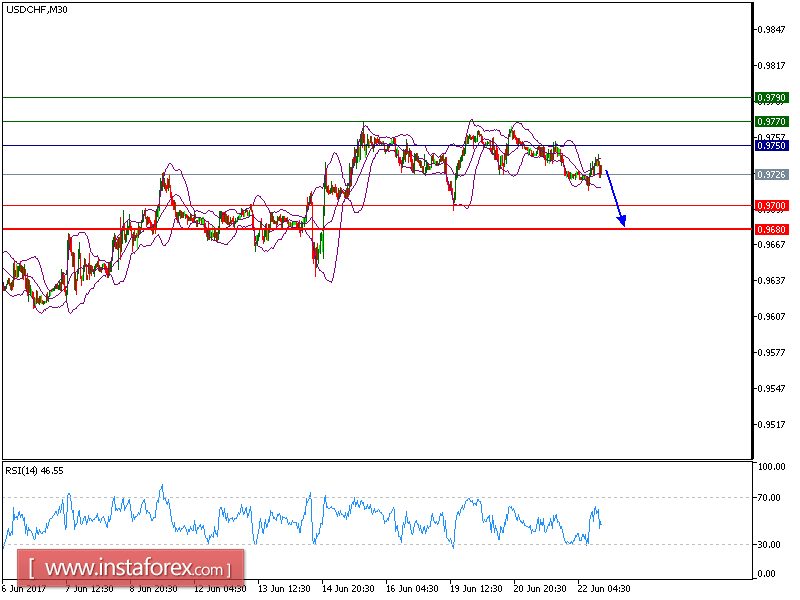
The pair is trading below its declining 20-period and 50-period moving averages, which are playing resistance roles and maintain the downside bias. The relative strength index is bearish and is calling for a further downside.
To sum up, as long as 0.9750 holds on the upside, a new drop to 0.9700 and even to 0.9680 seems more likely to occur.
Graph Explanation: The black line shows the pivot point, present price above pivot point indicates the bullish position and below pivot points indicates the short position. The red lines show the support levels and the green line indicates the resistance levels. These levels can be used to enter and exit trades.
Strategy: SELL, Stop Loss: 0.9750, Take Profit: 0.9700
Resistance levels: 0.9770, 0.9790, and 0.9875
Support levels: 0.97000, 0.9680, and 0.9655