 English
  Русский
 Bahasa Indonesia
 Bahasa Malay
 ไทย
ไทย Español
 Deutsch
 Български
 Français
 Tiếng Việt
 中文
中文 বাংলা
বাংলা हिन्दी
 Čeština
 Українська
 Română

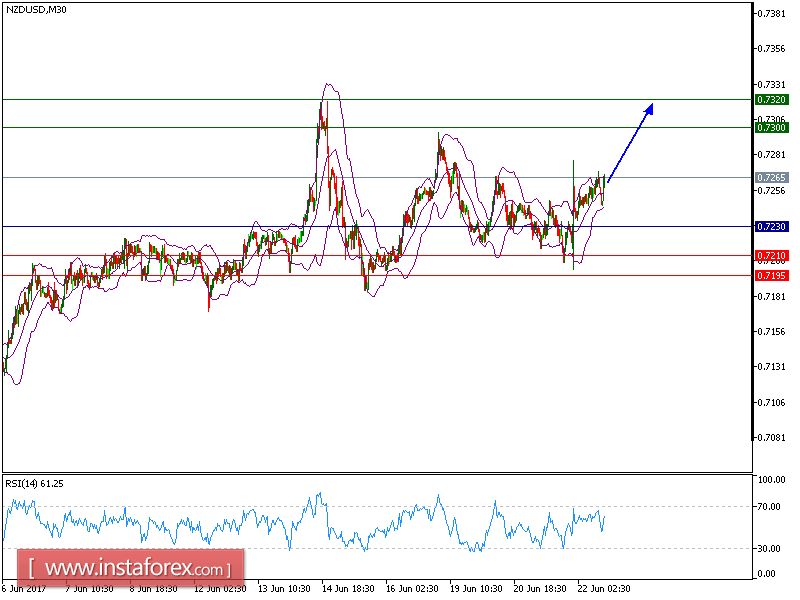
Our 20th June, targets have been hit precisely as predicted. NZD/USD rebounded from our second target 0.7195 and now is expected to trade with a bullish outlook. The pair made a rebound from 0.7195 (the low of June 21) and broke above both 20-period and 50-period moving averages. The relative strength index lacks downward momentum.
Hence, as long as 0.7210 holds on the downside, expect a further upside to 0.7260 and even to 0.7280 in extension.
Strategy: BUY Stop Loss: 0.7230. Take Profit: 0.7300
Chart Explanation: The black line shows the pivot point. Currently, the price is above the pivot point which indicates the bullish position. If it is below the pivot points, it indicates the short position. The red lines show the support levels and the green line indicates the resistance levels. These levels can be used to enter and exit trades.
Resistance levels: 0.7300, 0.7320, and 0.7355
Support levels: 0.7210, 0.7195, and 0.7160