 English
  Русский
 Bahasa Indonesia
 Bahasa Malay
 ไทย
ไทย Español
 Deutsch
 Български
 Français
 Tiếng Việt
 中文
中文 বাংলা
বাংলা हिन्दी
 Čeština
 Українська
 Română

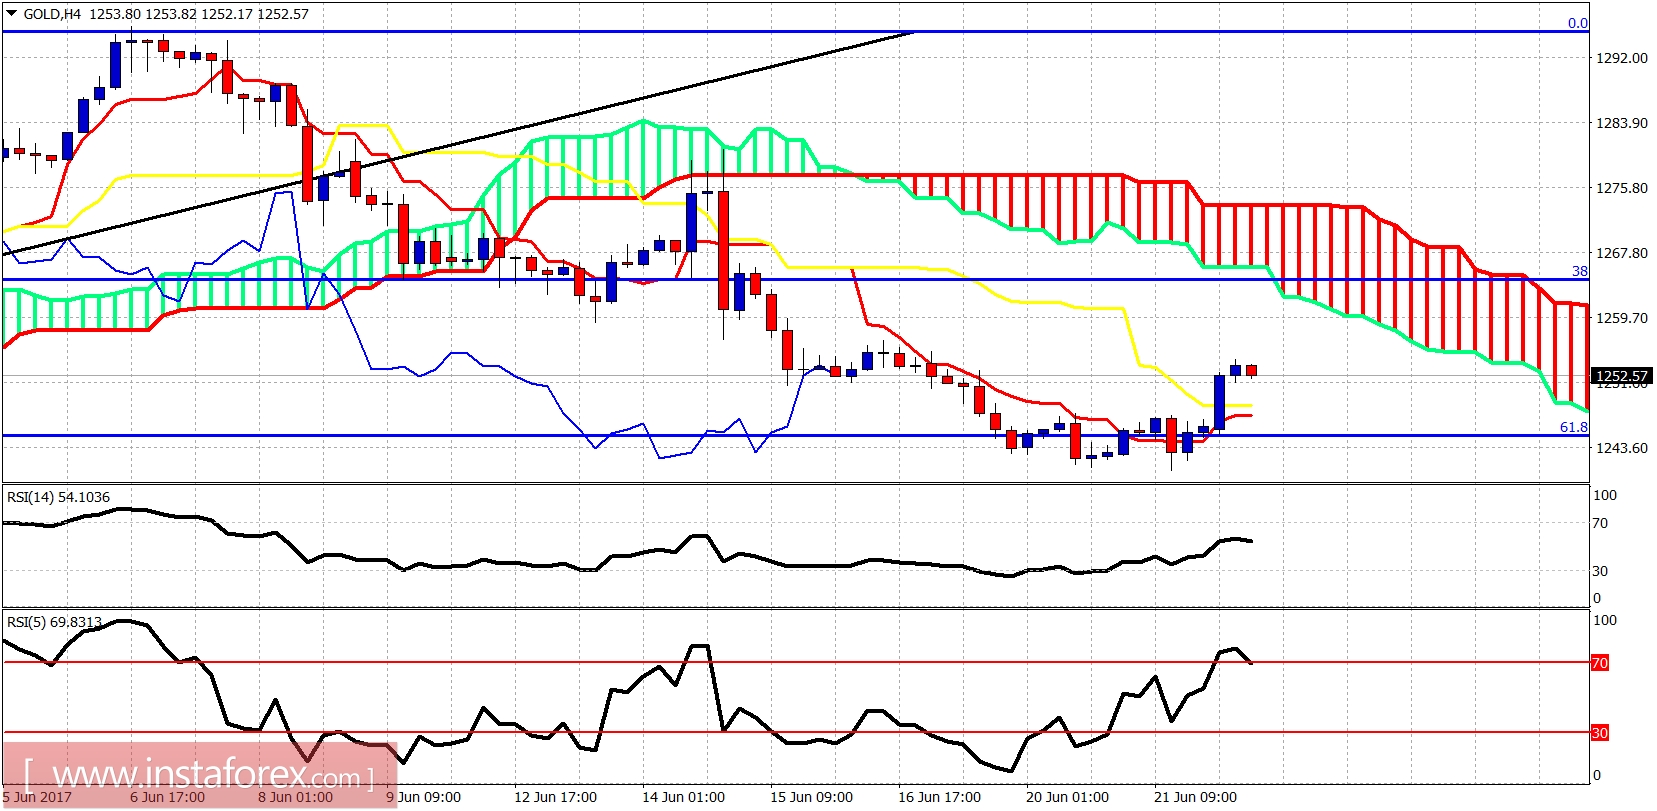
Gold price bounced off the 61.8% Fibonacci retracement and the $1,245-40 area as expected. Price should test the $1,260 short-term resistance area. A rejection there will open the way for a push towards $1,200, but if the week closes around $1,260 and higher, we could have a bullish reversal sign on a weekly basis.
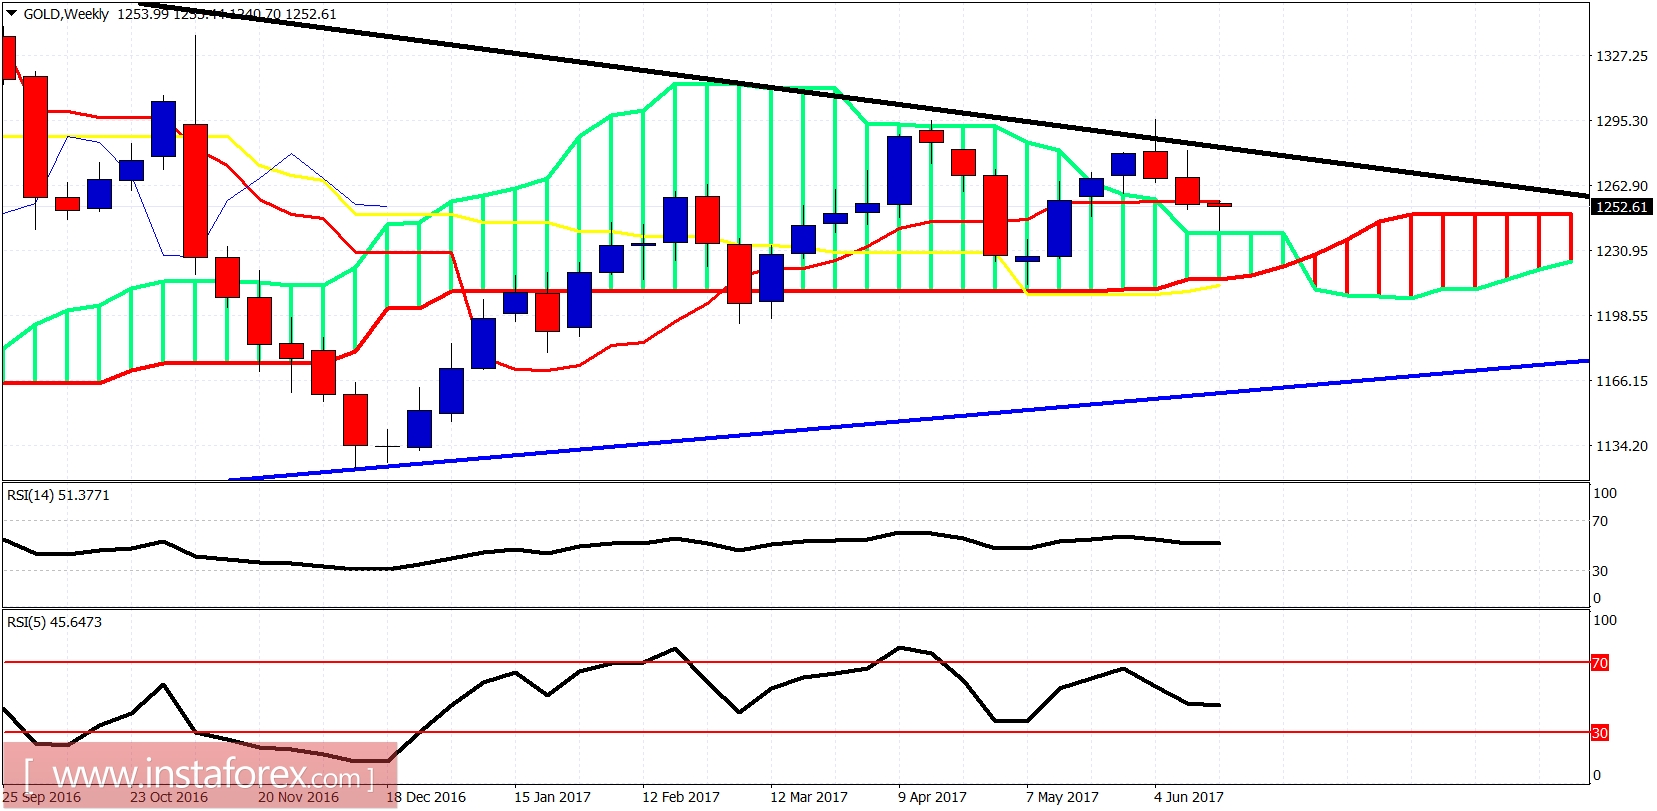
Blue line - long-term support
Gold weekly chart could shape up to be a very bullish one as the candle formation of this week touched the weekly Kumo (cloud) support as expected and bounced higher. This long-tailed candle is a bullish reversal sign and will strengthen the higher we close this week. I'm short-term and longer-term bullish about Gold.