 English
  Русский
 Bahasa Indonesia
 Bahasa Malay
 ไทย
ไทย Español
 Deutsch
 Български
 Français
 Tiếng Việt
 中文
中文 বাংলা
বাংলা हिन्दी
 Čeština
 Українська
 Română

The US dollar index bounced as expected but found formidable resistance at 97.50 and got rejected. As long as we hold above the May lows, bulls have some hopes for a bigger bounce towards 99.
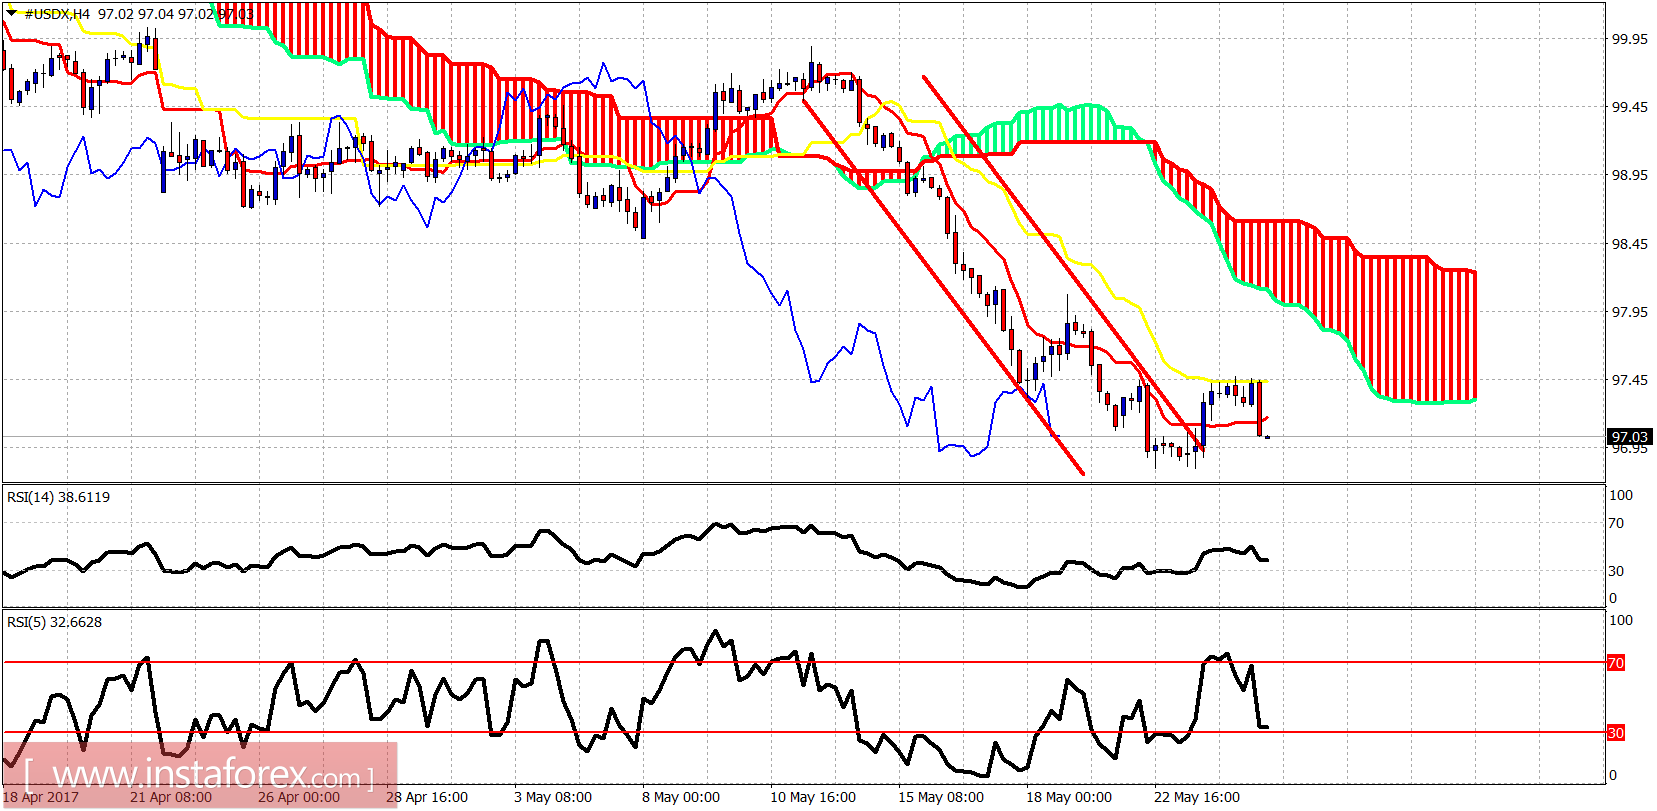
Though the price broke out of the bearish channel, the bounce reached only the kijun-sen (yellow line indicator) in the 4 hour chart but not the Kumo (cloud) as we hoped. However, the bounce might still be incomplete so we have to be patient as long as we trade above the May lows.
Green line - support
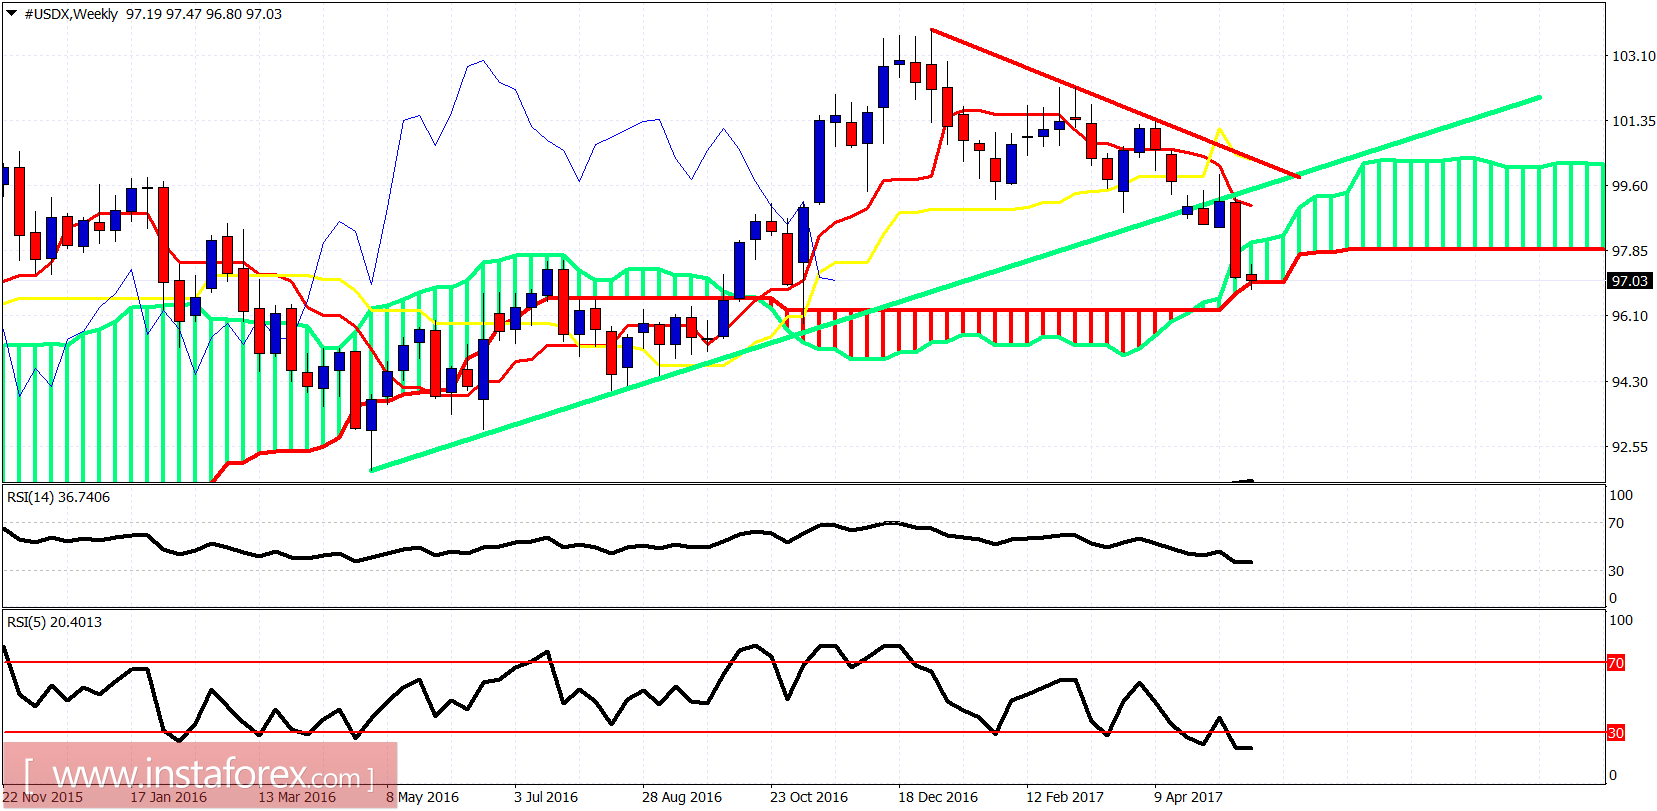
The weekly chart is dangerously turning weekly trend to bearish, especially if this week closes below the Kumo cloud. We are at the very important weekly support. I continue to believe that a bounce is quite possible towards 99. One need to be patient and wait and see.