 English
  Русский
 Bahasa Indonesia
 Bahasa Malay
 ไทย
ไทย Español
 Deutsch
 Български
 Français
 Tiếng Việt
 中文
中文 বাংলা
বাংলা हिन्दी
 Čeština
 Українська
 Română

Gold price as expected is pushing lower towards $1,260 as we justified a correction from last week. The causation today are the French election results. Technically Gold price could continue lower towards $1,260 or even $1,250 but my longer-term view remains unchanged.
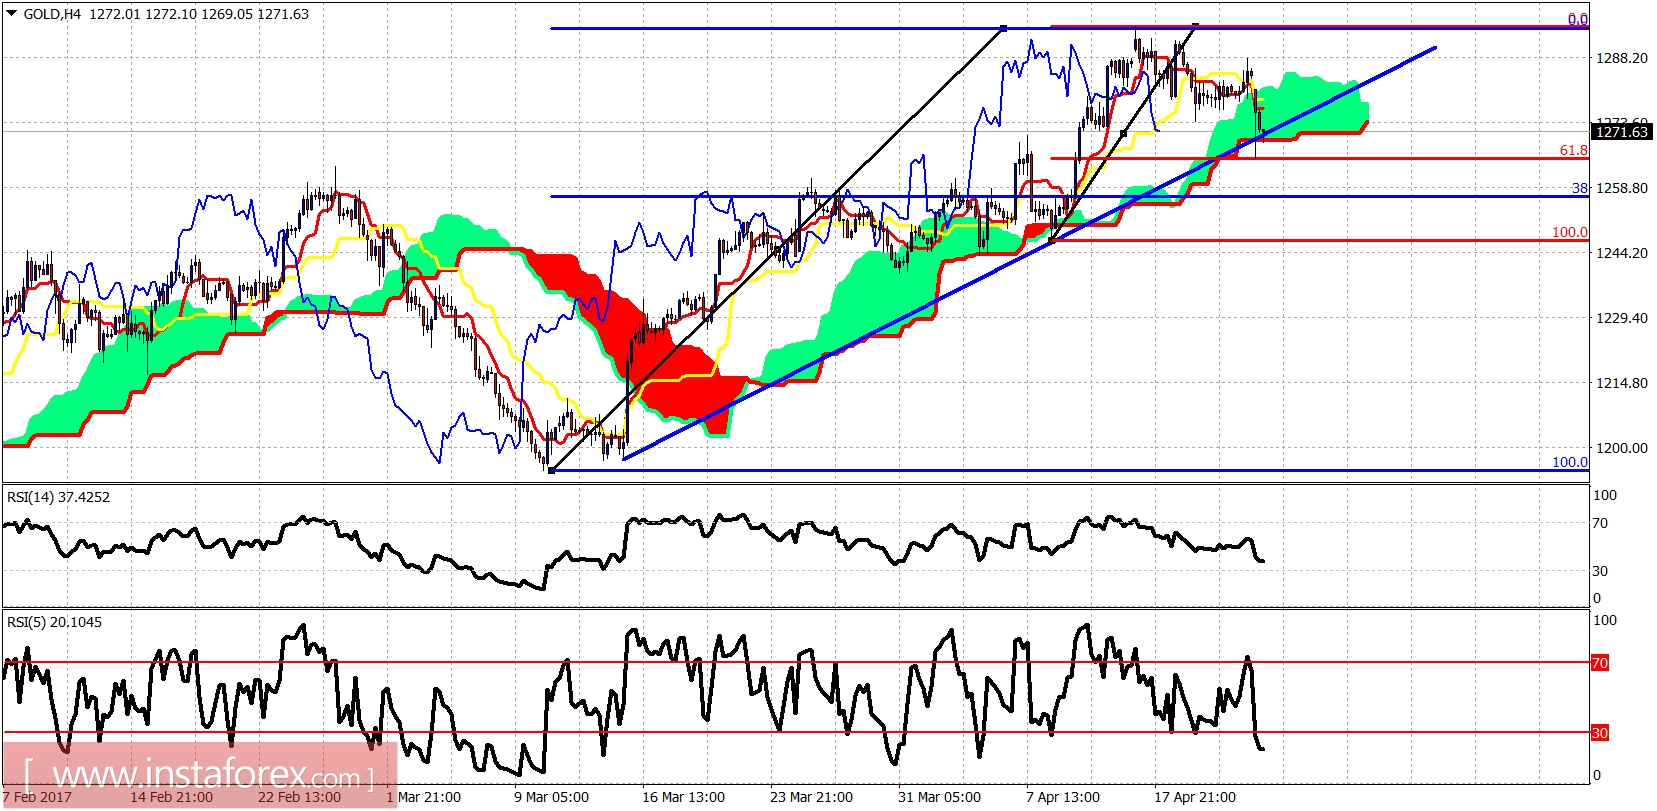
Blue line - support
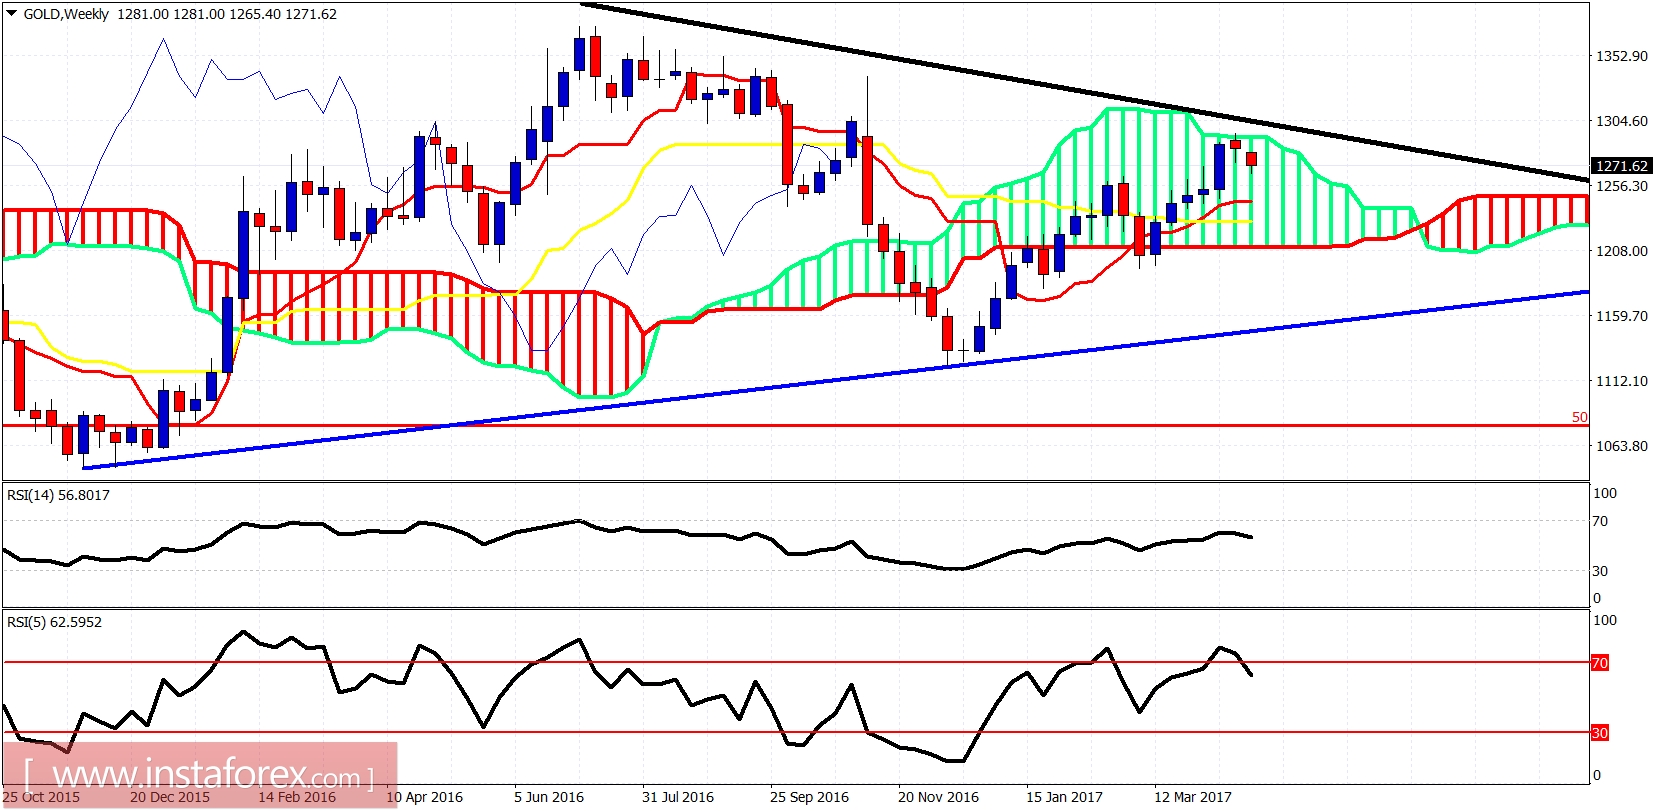
As we expected from last week Gold price got rejected at the upper cloud boundary and at the black long-term trend line resistance. Weekly support is at the red tenkan-sen indicator at $1,245. My longer-term view remains bullish. This downward move is most probably the last chance for long positions in Gold before the big breakout.