 English
  Русский
 Bahasa Indonesia
 Bahasa Malay
 ไทย
ไทย Español
 Deutsch
 Български
 Français
 Tiếng Việt
 中文
中文 বাংলা
বাংলা हिन्दी
 Čeština
 Українська
 Română

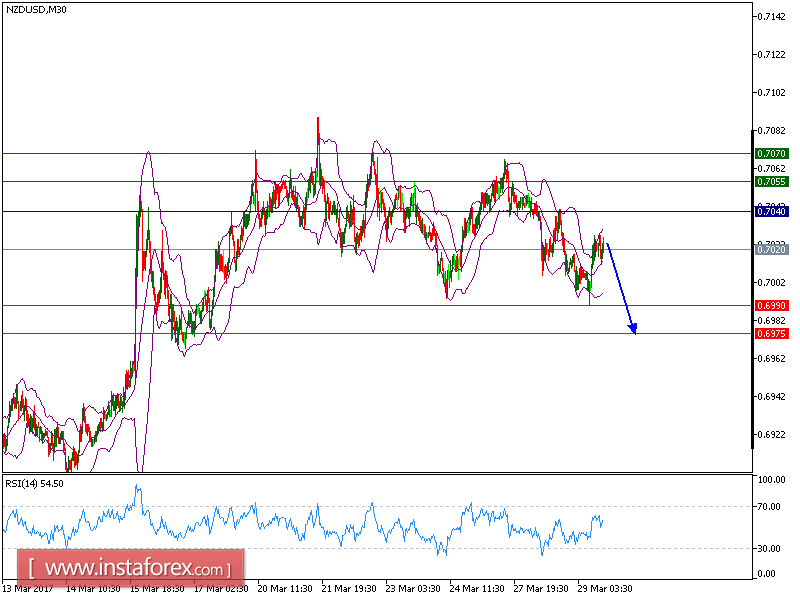
NZD/USD is under pressure. The pair recorded lower tops and lower bottoms since March 27, which confirmed a negative outlook. The downward momentum is further reinforced by the descending 20-period and 50-period moving averages. The relative strength index is capped by the bearish trend line since March 26.
Therefore, as long as 0.7040 holds on the upside, look for a further drop to 0.6990 and even to 0.6975 in extension.
The pair is trading below its pivot point. It is likely to trade in a lower range as long as it remains below the pivot point. Short positions are recommended with the first target at 0.6990. A break below this target will move the pair further downwards to 0.6975. The pivot point stands at 0.7040. If the price moves in the opposite direction and bounces back from the support level, it will move above its pivot point. It is likely to move further to the upside. According to that scenario, long positions are recommended with the first target at 0.7055 and the second one at 0.7070.
Resistance levels: 0.7055, 0.7070, and 0.7105
Support levels: 0.6990, 0.6975, and 0.6940