 English
  Русский
 Bahasa Indonesia
 Bahasa Malay
 ไทย
ไทย Español
 Deutsch
 Български
 Français
 Tiếng Việt
 中文
中文 বাংলা
বাংলা हिन्दी
 Čeština
 Українська
 Română

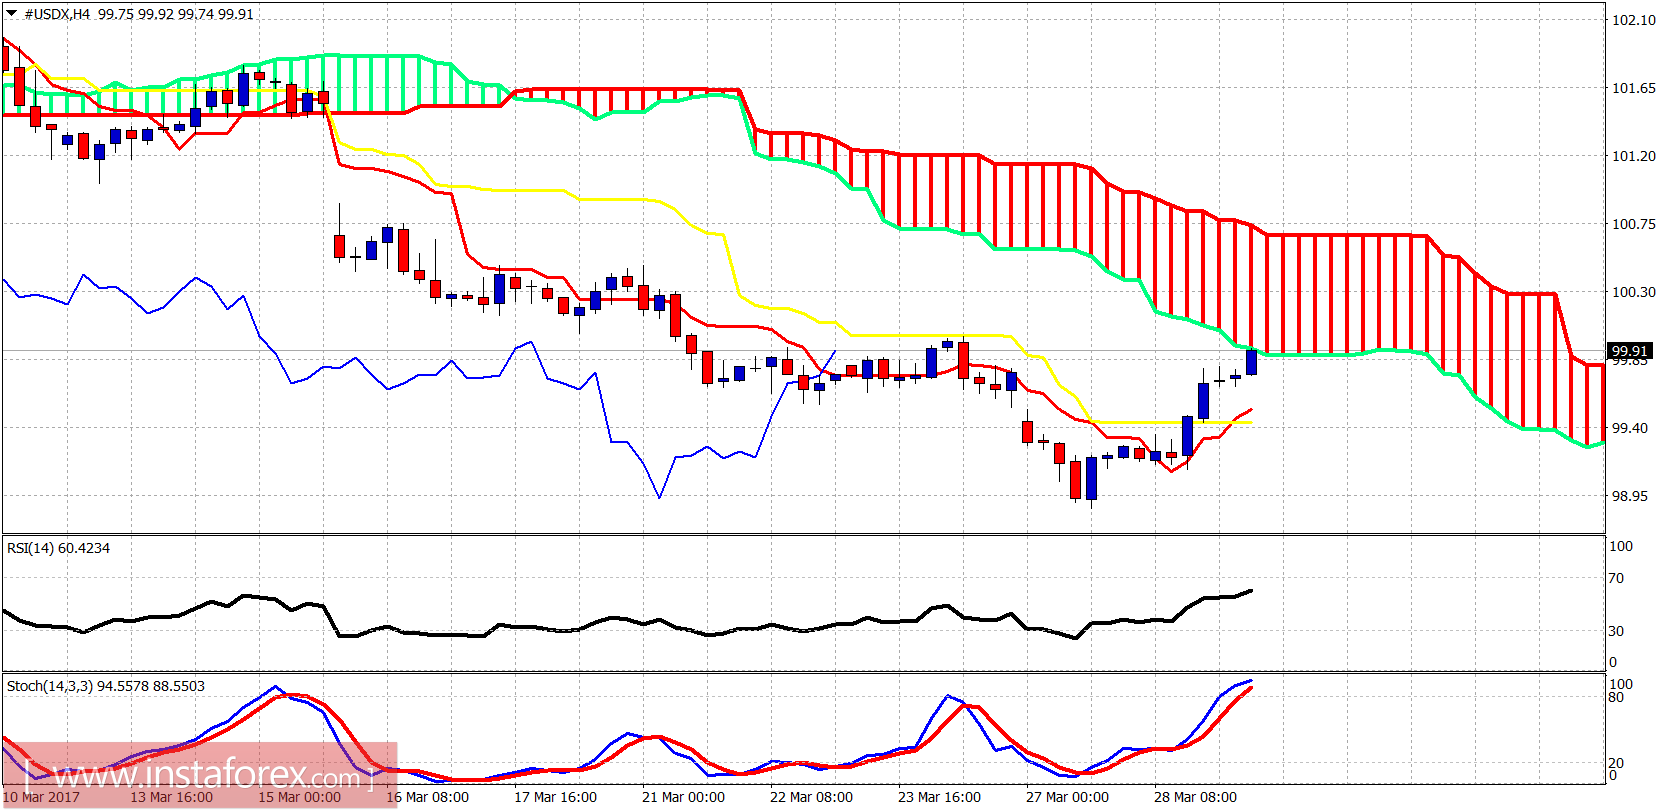
The Dollar index bounced as we were expecting since the divergence signals were increasing. The Dollar index has bounced off important support at 99-98.80 area and is trying to break above the first important resistance levels. I believe the most probable outcome will be a lower high and another bearish reversal.
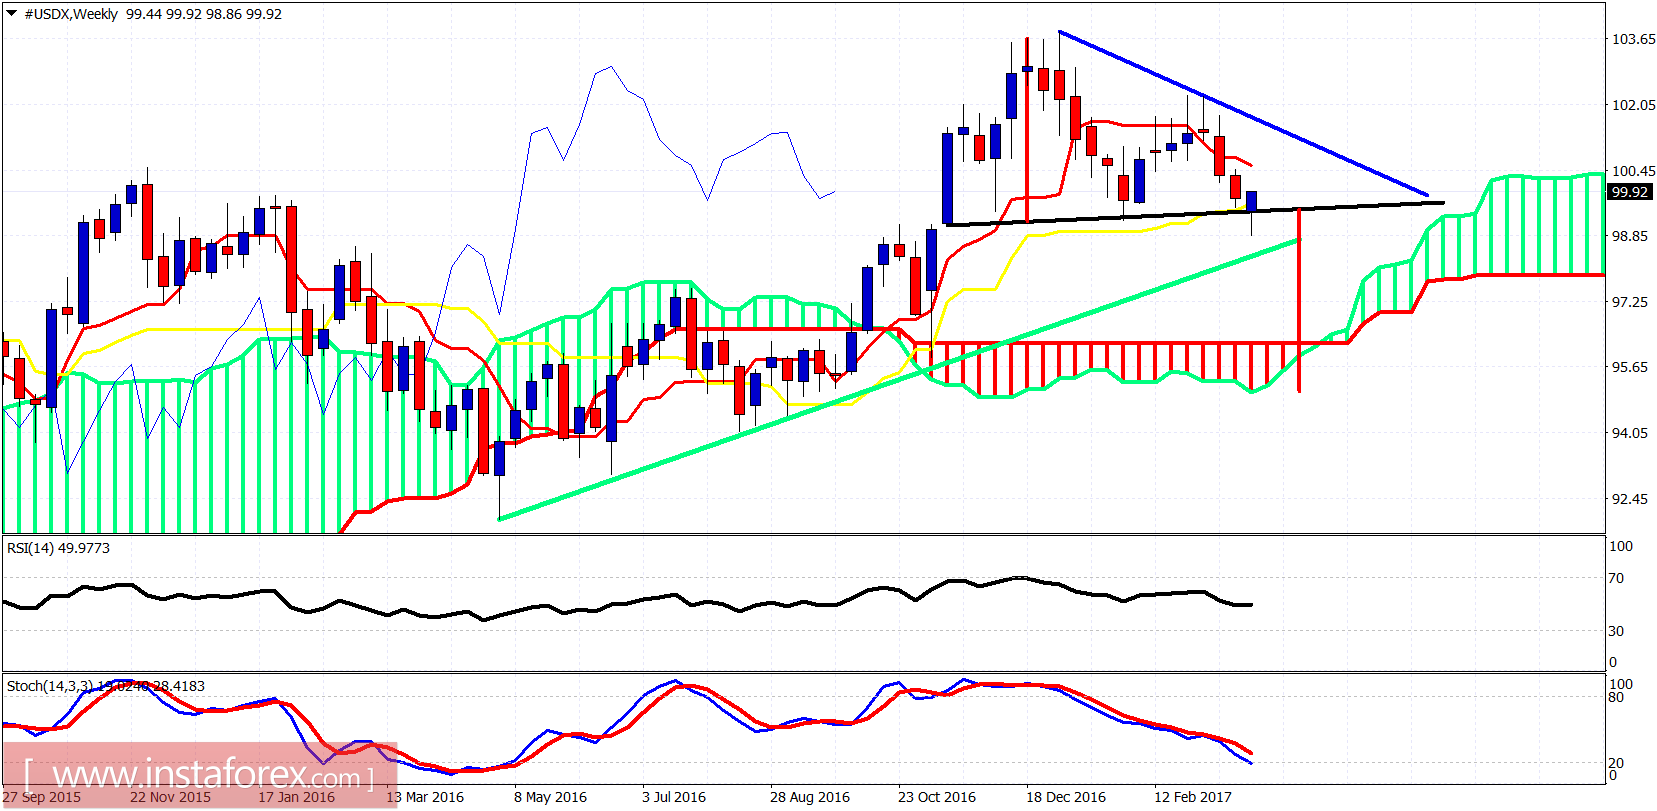
Blue line -trend line resistance
Green line -long-term trend line support
The Dollar index owed us a bounce from oversold levels and delivered it yesterday despite the weakness it showed on Monday. As I said in a previous post, weekly candles are not shaped on Monday and that is why we need to be patient with the weekly close. I expect the Dollar index to make a lower high relative to the 102.30 and then reverse lower towards 98 or even 97.