 English
  Русский
 Bahasa Indonesia
 Bahasa Malay
 ไทย
ไทย Español
 Deutsch
 Български
 Français
 Tiếng Việt
 中文
中文 বাংলা
বাংলা हिन्दी
 Čeština
 Українська
 Română

The pair continues to follow the upside bias above the 1.2400 handle across the board, as the resistance zone of 1.2512 still provides a nice barrier to cap further gains. However, if GBP/USD breaks below 1.2391, then it can plunge to test the 1.2292 level, which is below the 200 SMA at H1 chart. MACD indicator is turning flat, favoring for sideways.
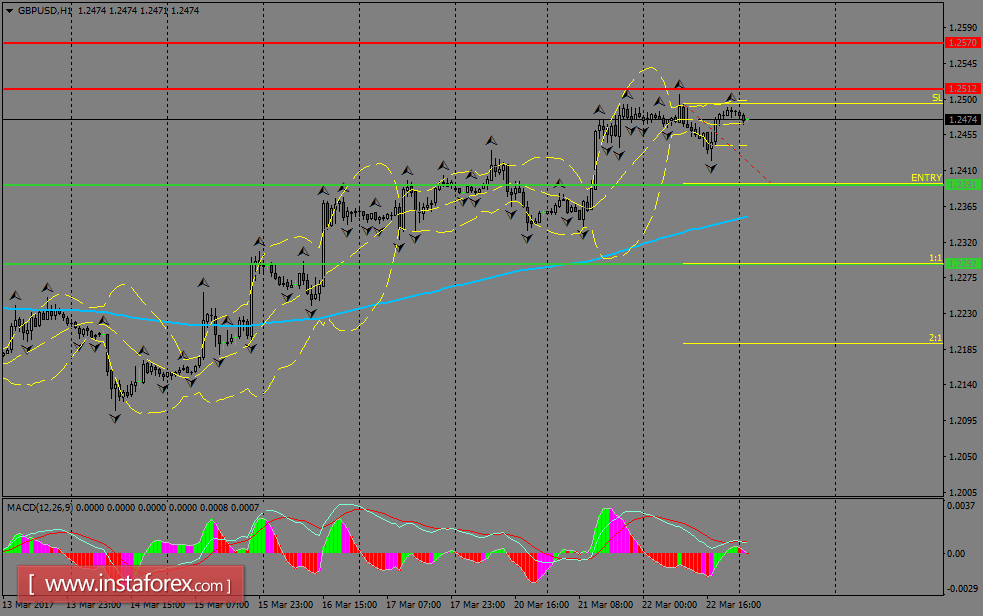
H1 chart's resistance levels: 1.2512 / 1.2570
H1 chart's support levels: 1.2391 / 1.2292
Trading recommendations for today: Based on the H1 chart, sell (short) orders only if the GBP/USD pair breaks a bearish candlestick; the support level is at 1.2391, take profit is at 1.2292 and stop loss is at 1.2493.