 English
  Русский
 Bahasa Indonesia
 Bahasa Malay
 ไทย
ไทย Español
 Deutsch
 Български
 Français
 Tiếng Việt
 中文
中文 বাংলা
বাংলা हिन्दी
 Čeština
 Українська
 Română

The bearish bias in USDX still remains alive in the short-term, as the support zone of 100.15 could be broken in coming hours. If the index does a breakout below the 100.15 level, then we can expect a testing of the 99.66 level. Overall, USDX is following the bearish trend well consolidated below the 200 SMA on H1 chart.
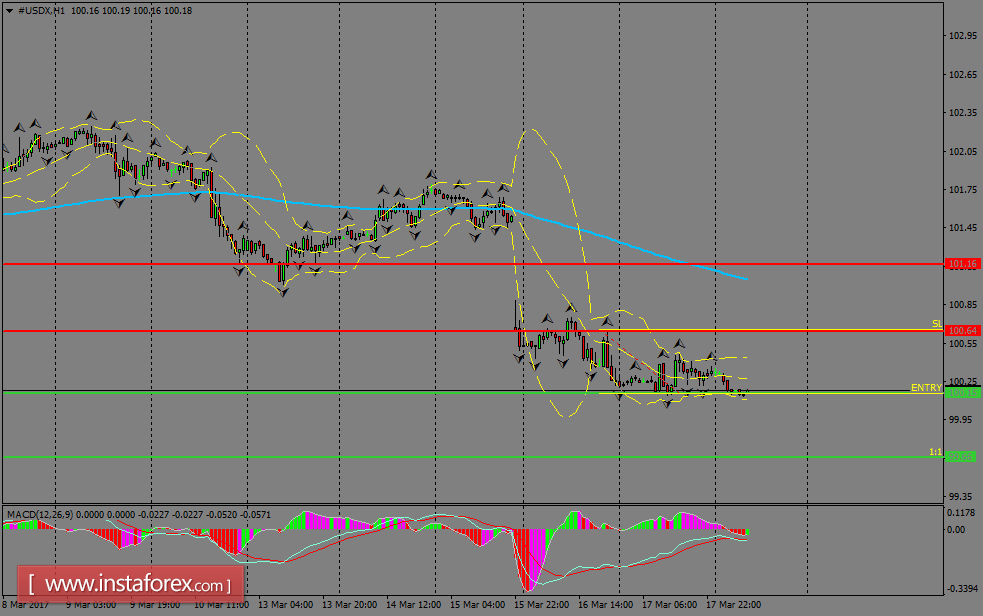
H1 chart's resistance levels: 100.64 / 101.16
H1 chart's support levels: 100.15 / 99.66
Trading recommendations for today: Based on the H1 chart, place sell (short) orders only if the USD Index breaks with a bearish candlestick; the support level is at 100.15, take profit is at 99.66 and stop loss is at 100.64.