 English
  Русский
 Bahasa Indonesia
 Bahasa Malay
 ไทย
ไทย Español
 Deutsch
 Български
 Français
 Tiếng Việt
 中文
中文 বাংলা
বাংলা हिन्दी
 Čeština
 Українська
 Română

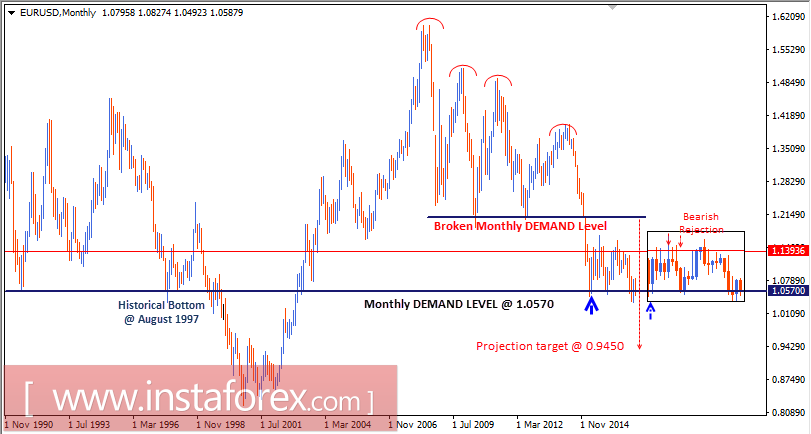
In January 2015, the EUR/USD pair moved below the major demand levels near 1.2100 where historical bottoms were previously set in July 2012 and June 2010.
Hence, a long-term bearish target was projected toward 0.9450.
In March 2015, the EUR/USD bears challenged the monthly demand level around 1.0570, which had been previously reached in August 1997.
Later in April 2015, a strong bullish recovery was observed around the mentioned demand level.
However, next monthly candlesticks (September, October, and November) reflected a strong bearish rejection around the area of 1.1400-1.1500.
In the longer term, the level of 0.9450 remains a projected target if the current monthly candlestick achieves bearish closure below the depicted monthly demand level of 1.0570.
Otherwise, the EUR/USD pair will remain trapped within the depicted consolidation range (1.0570-1.1400).
The longer term outlook for the EUR/USD pair remains bearish as the monthly chart illustrates. Bearish persistence below 1.0575 is needed to pursue this bearish scenario.
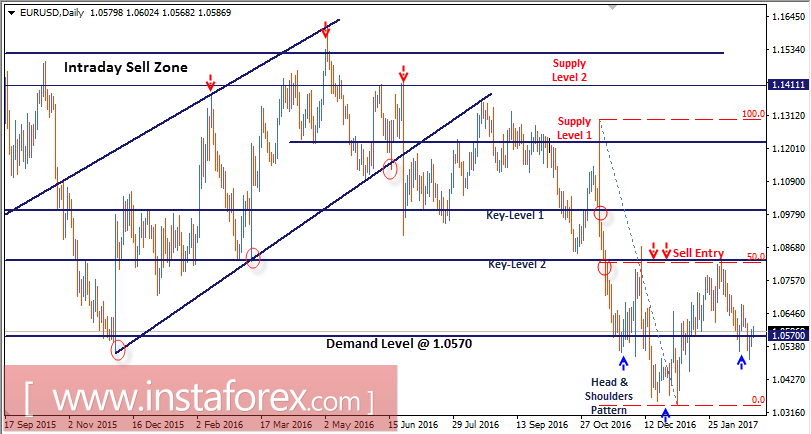
On November 14, bearish persistence below 1.0825 (Key Level 2) allowed further decline toward 1.0570 (demand level) where evident bullish rejection was expressed on November 24.
Shortly after, the Fibonacci Level 50% (1.0825) constituted a recent supply level which offered a valid SELL entry on December 8.
Bearish persistence below the depicted demand level (1.0570) was expected to allow further decline toward 1.0220. However, significant bullish recovery was expressed around the price level of 1.0340 on January 3.
Bullish persistence above 1.0600 allowed further advance toward 1.0825-1.0850 (Fibonacci Level 50%) where bearish rejection and a valid SELL entry were anticipated.
At the moment, the price level of 1.0570-1.0500 stands as a prominent demand zone to be watched for a valid bullish entry (note the bullish Head & Shoulders Pattern with the initial target at 1.0800).
Otherwise, further decline can be executed toward 1.0400 if the current break below 1.0570 is maintained.