 English
  Русский
 Bahasa Indonesia
 Bahasa Malay
 ไทย
ไทย Español
 Deutsch
 Български
 Français
 Tiếng Việt
 中文
中文 বাংলা
বাংলা हिन्दी
 Čeština
 Українська
 Română

The US dollar weakness intensified yesterday once the price broke below 101.40 as we expected. The price broke our short-term support and has already reached our first target of 100.80 as I mentioned in yesterday's analysis.
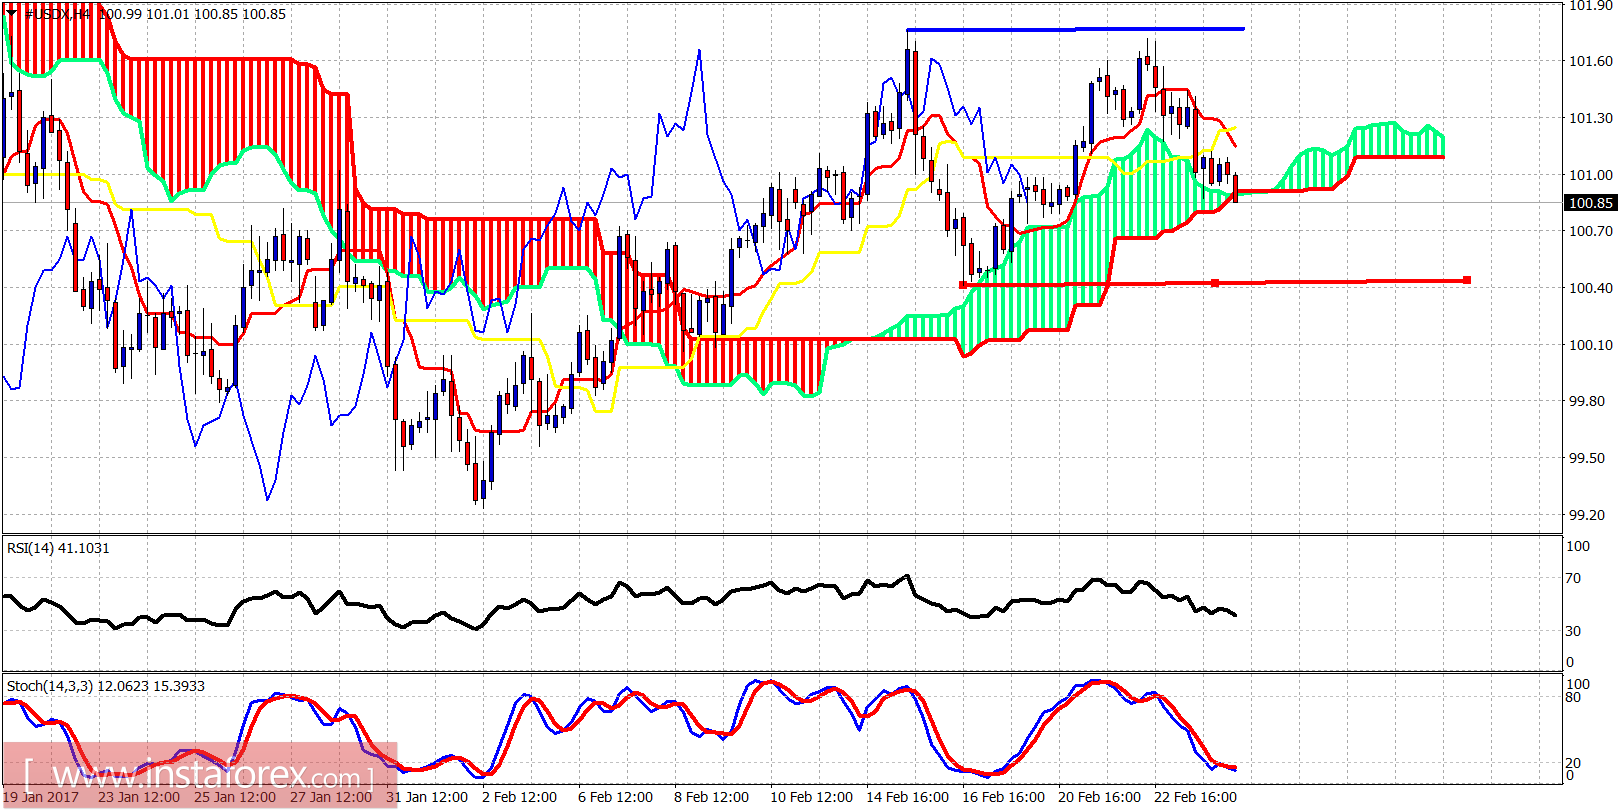
Red line - support
The 4-hour chart of the US dollar index is not promising. A double top formation and a break below the Kumo (cloud) support are worrying signs for bulls. If support at 100.40 breaks, then the 99.25 level will be in danger. Bulls need to recapture the 101.40 level again and make a higher low for the bullish scenario to work.
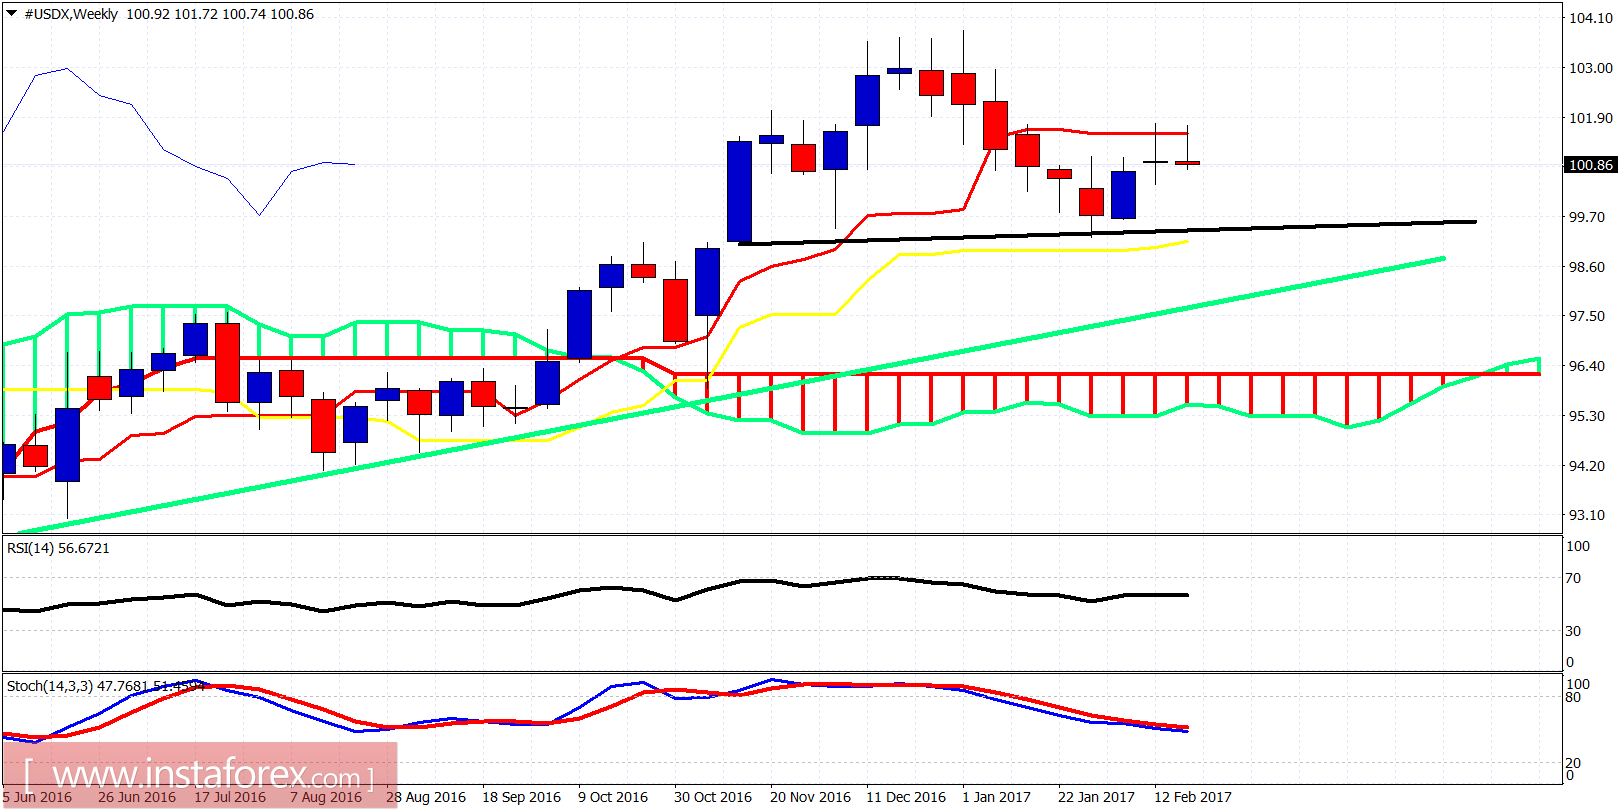
Green line - long-term trend line support
The weekly chart shows us that traders are indecisive and there is no clear trend in the short term. In the longer term,m the price remains above the critical support at 99.25 where the neckline of the weekly Head and Shoulders pattern is found. T he price got rejected at the weekly tenkan-sen (Red line indicator). This is not a good sign. Above 101.80, we see 103 and new highs. Below 99.25 bad news for bulls.