 English
  Русский
 Bahasa Indonesia
 Bahasa Malay
 ไทย
ไทย Español
 Deutsch
 Български
 Français
 Tiếng Việt
 中文
中文 বাংলা
বাংলা हिन्दी
 Čeština
 Українська
 Română

The gold price has broken out of the ascending triangle pattern as we expected. The minimum target is at $1,300. The trend is bullish. We could see a pullback towards the $1,247-45 area, but I expect the trend to continue.
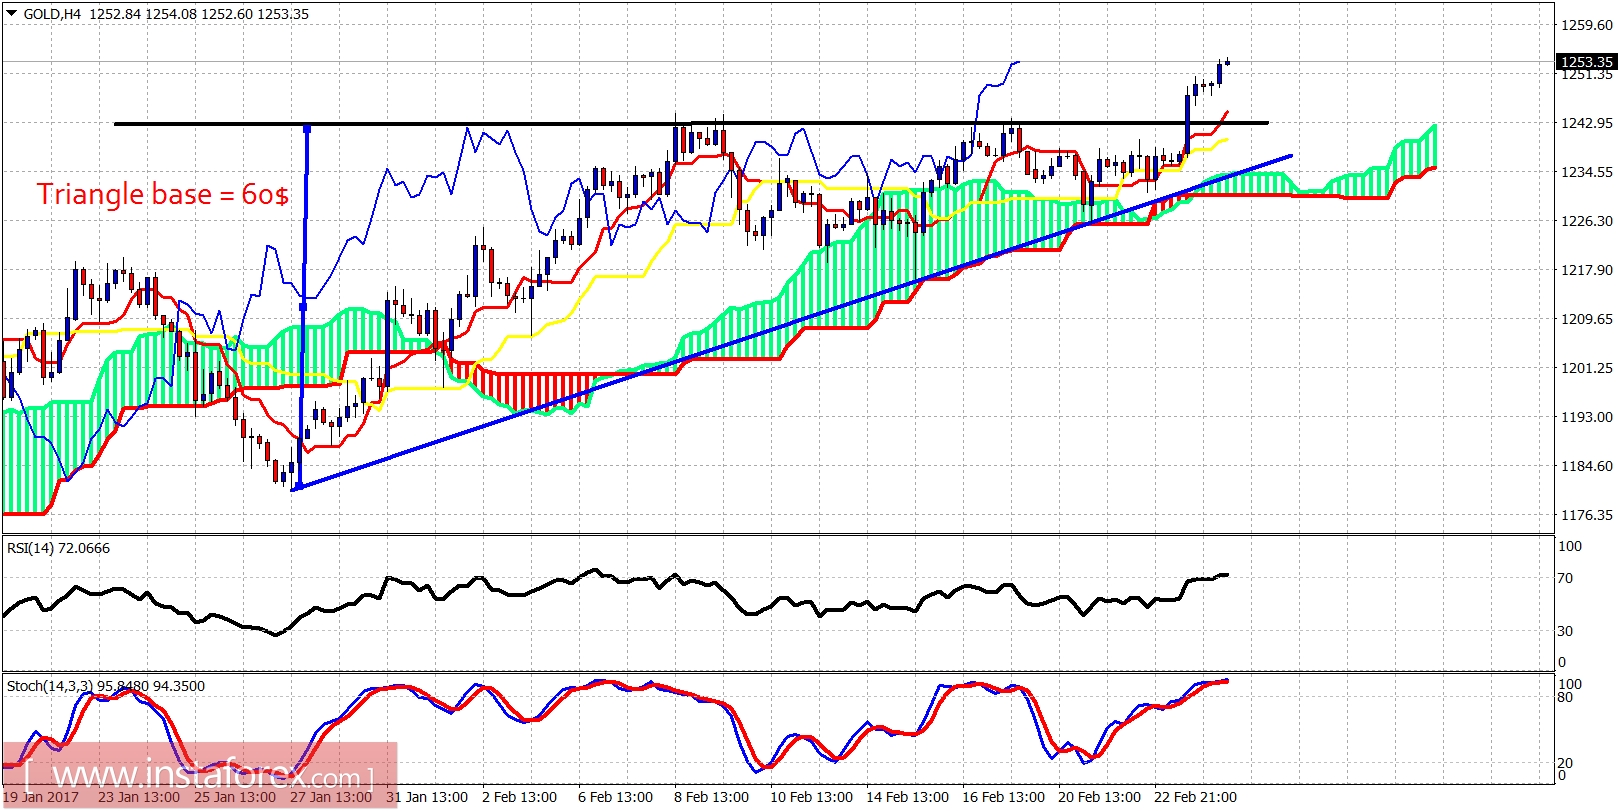
Blue line - support
The base of the ascending triangle is 60$ approximately. The break out above $1,245 should provide a similar size upward move. Therefore the target is $1,245 plus 60$ at $1,300. There are no divergence signs on the four-hour chart. I expect the uptrend to continue.
Black line -long-term resistance
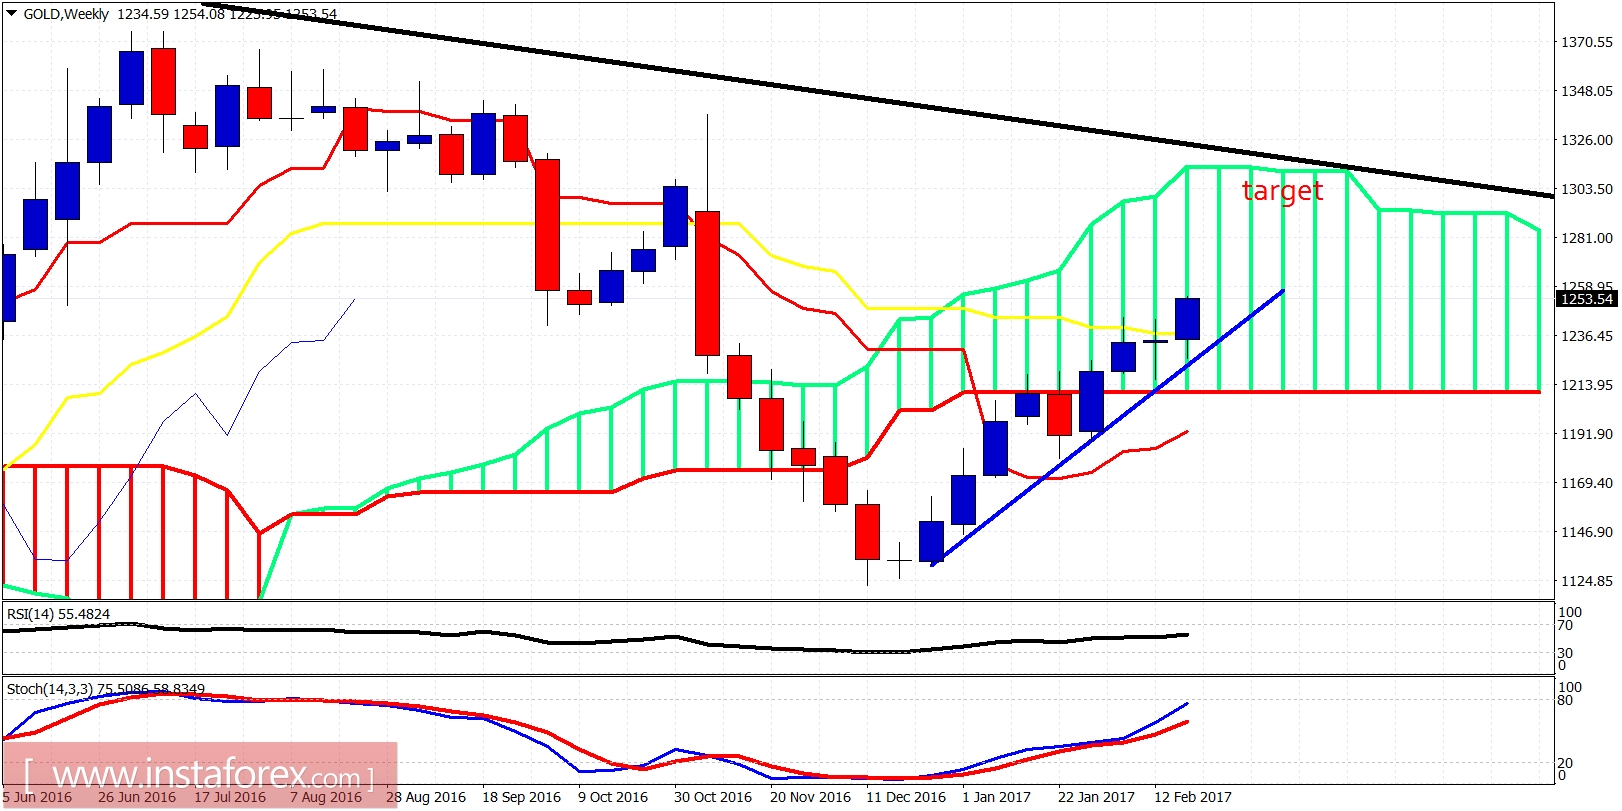
The gold price is breaking above the weekly kijun-sen (yellow line indicator). This is a very bullish sign. The oscillators have room to the upside so I expect the long-term resistance trend line to be tested. So our target of $1,300 is very possible over the coming weeks.