The Dollar index has reached important short-term support. Is the entire pullback over or is it just the first part? As long as the price is trading above 99.20 we remain bullish for the Dollar, as the low could very well be the end of wave 4, while the current bounce could be the start of the new leg up to new highs.
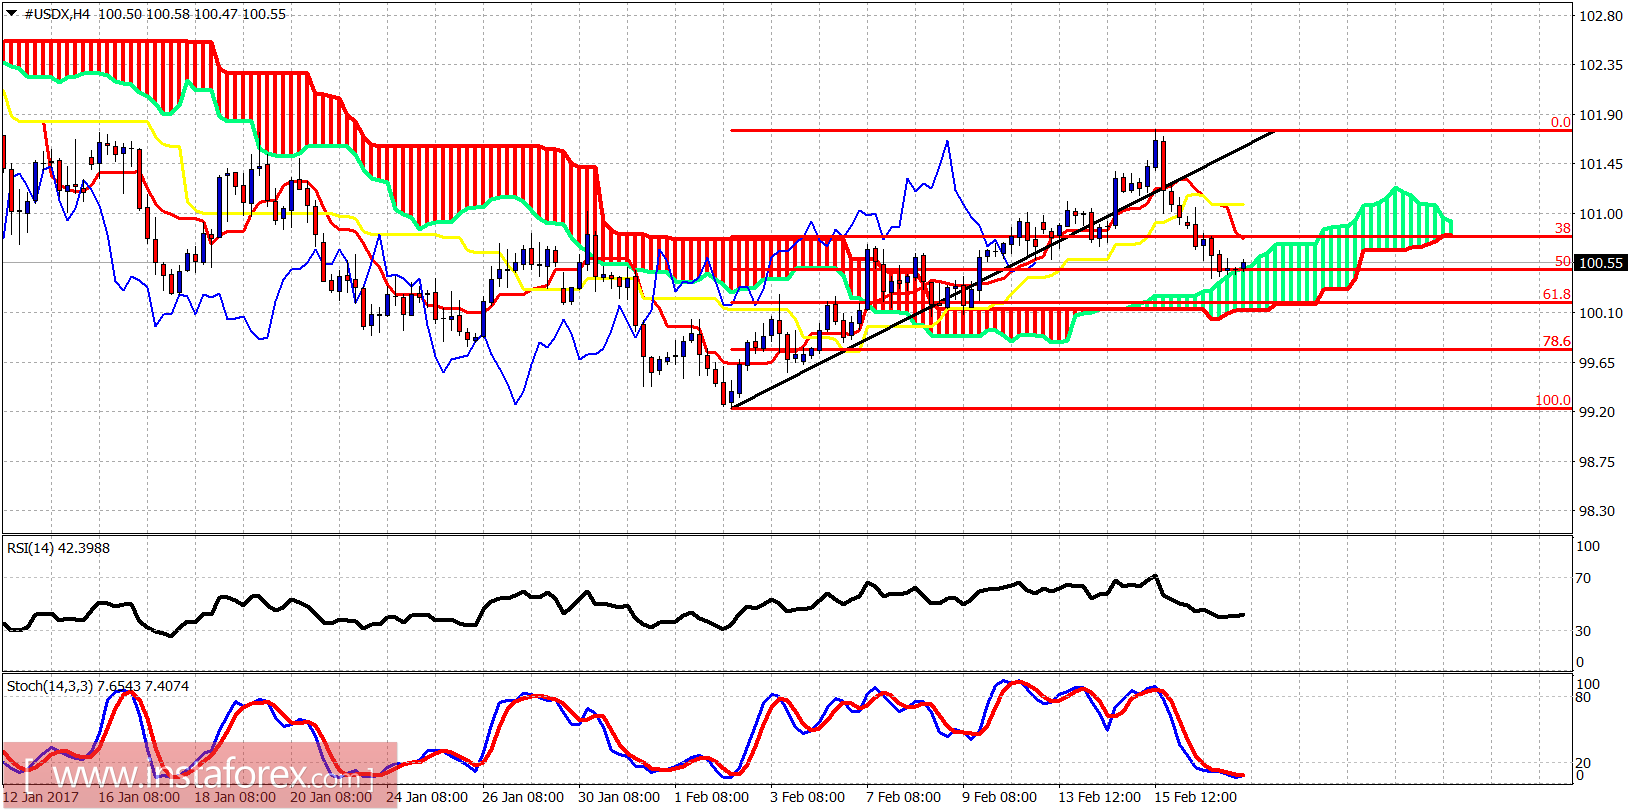
The Dollar index has reached the Ichimoku cloud support and the 50% retracement of the recent rise. This could be the entire pullback and we could see the start of a new uptrend from the current levels. Important short-term support is at the 100.20 level and the 61.8% Fibo.
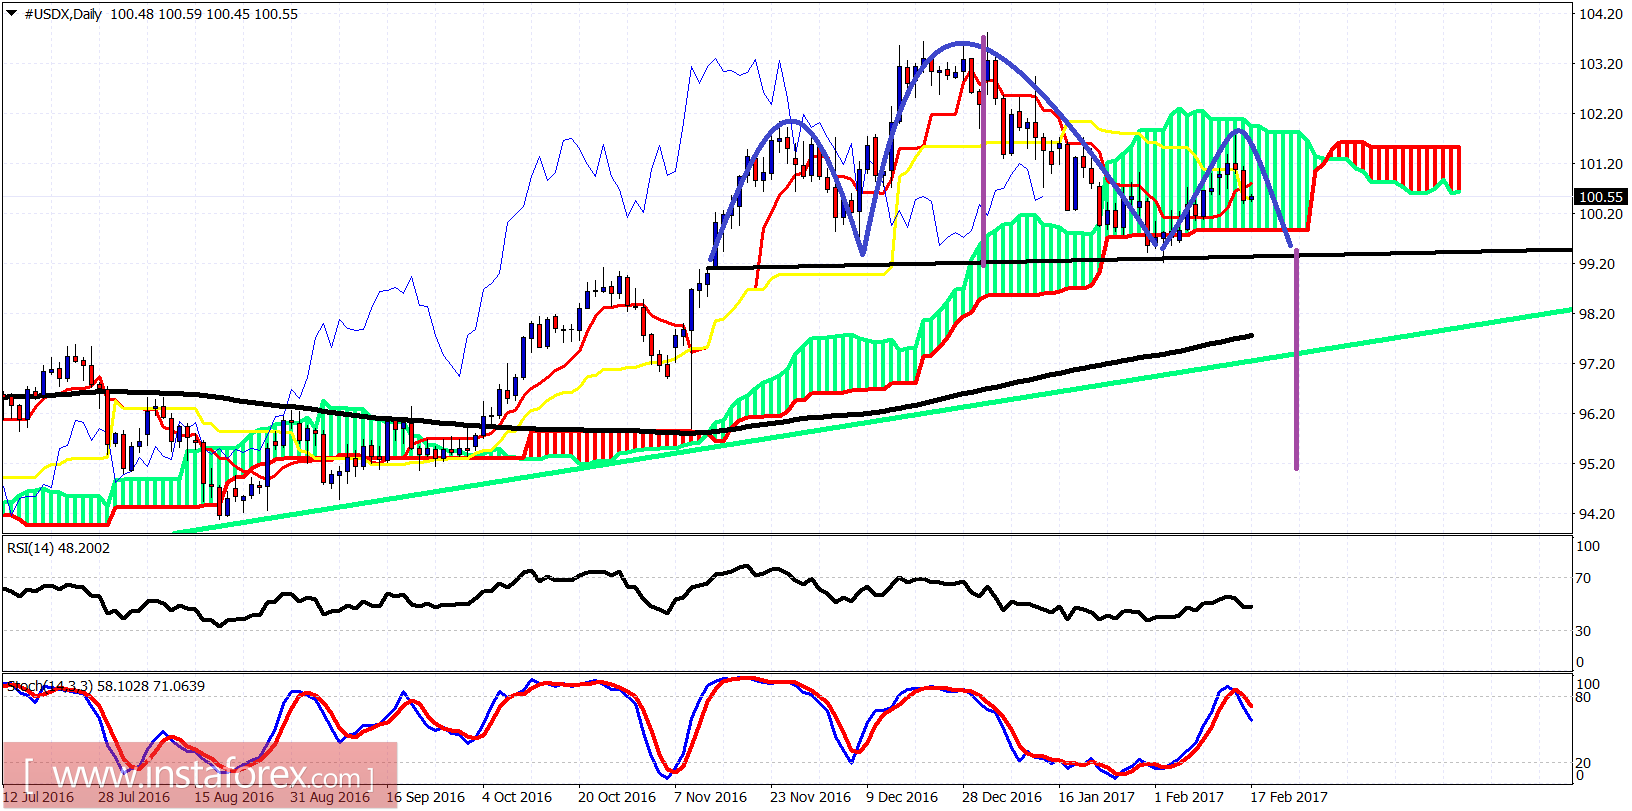
The Dollar index could also be forming a head and shoulders pattern. The neckline support is at 99-99.20 and if we break below that level we should expect the Dollar index to fall towards 95. Daily resistance is at 101.70. A break above that level will confirm the initial bullish scenario that wave 4 was complete at the recent low at 99.20.
*The market analysis posted here is meant to increase your awareness, but not to give instructions to make a trade
 English
  Русский
 Bahasa Indonesia
 Bahasa Malay
 ไทย
ไทย Español
 Deutsch
 Български
 Français
 Tiếng Việt
 中文
中文 বাংলা
বাংলা हिन्दी
 Čeština
 Українська
 Română
