 English
  Русский
 Bahasa Indonesia
 Bahasa Malay
 ไทย
ไทย Español
 Deutsch
 Български
 Français
 Tiếng Việt
 中文
中文 বাংলা
বাংলা हिन्दी
 Čeština
 Українська
 Română

USDX resumed the downside bias with a consolidation in the short term below the 200 SMA at H1 chart. Next target is located around 100.00, where a breakout should deliver more bearish pressure to test the 99.00 psychological level. However, if the resistance area of 101.43 gives up, then we can expect further gains toward the 102.39 level.
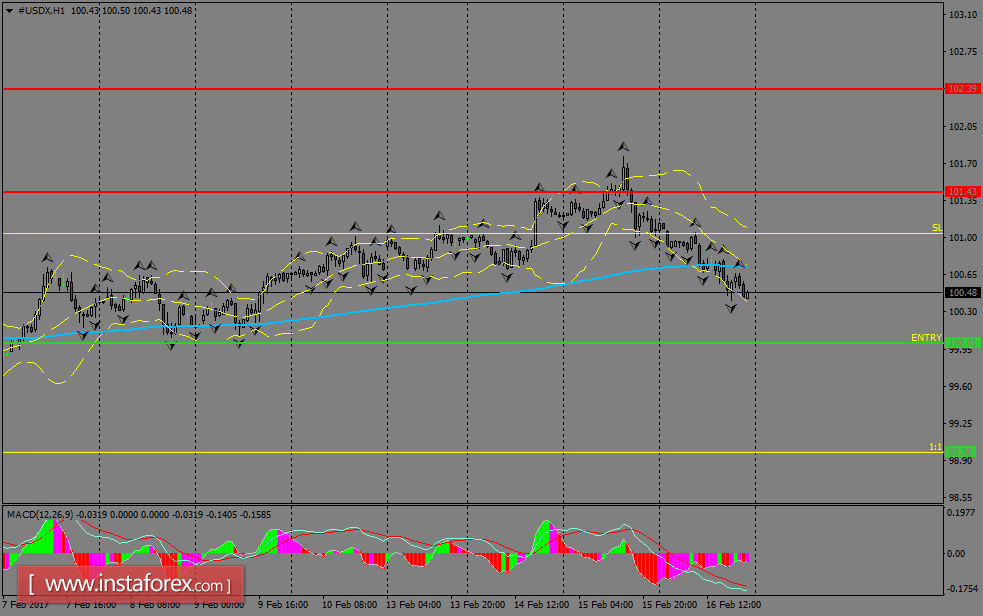
H1 chart's resistance levels: 101.43 / 102.38
H1 chart's support levels: 100.01 / 98.98
Trading recommendations for today: Based on the H1 chart, place sell (short) orders only if the USD Index breaks with a bearish candlestick; the support level is at 100.01, take profit is at 98.98 and stop loss is at 101.03.