 English
  Русский
 Bahasa Indonesia
 Bahasa Malay
 ไทย
ไทย Español
 Deutsch
 Български
 Français
 Tiếng Việt
 中文
中文 বাংলা
বাংলা हिन्दी
 Čeština
 Українська
 Română

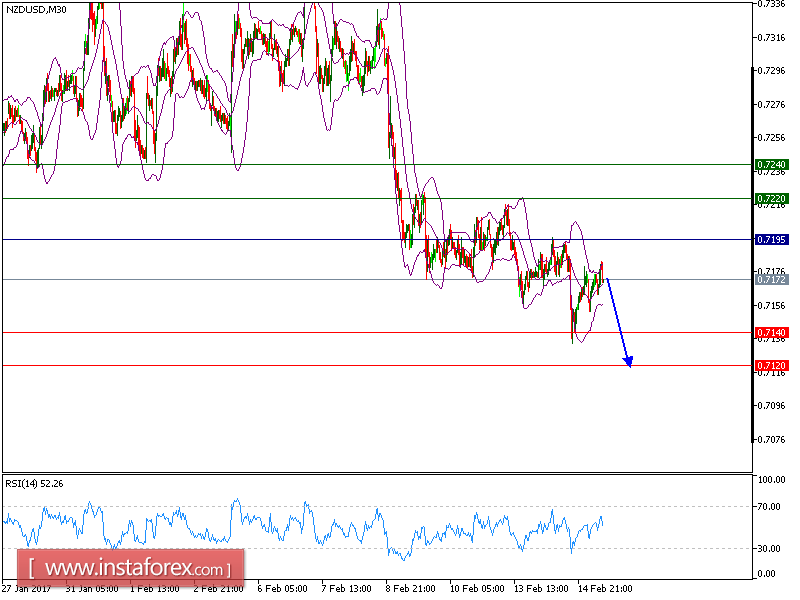
NZD/USD is expected to trade with bearish bias as Key resistance at 0.7195. Despite of a recent rebound, the pair is still trading below the descending 50-period moving average, which plays a resistance role. In addition, 0.7195 (the previous top) represents a significant key resistance level, which should limit the upside potential. Even though a continuation of technical rebound cannot be ruled out, its extent should be limited. As long as 0.7195 is not surpassed, the pair is likely to return to its previous low at 0.7140. A break below this level would call for a further drop toward 0.7120.
The pair is trading below its pivot point. It is likely to trade in a lower range as long as it remains below the pivot point. Short positions are recommended with the first target at 0.7140. A break below this target will move the pair further downwards to 0.7120. The pivot point stands at 0.7195. If the price moves in the opposite direction and bounces back from the support level, it will move above its pivot point. It is likely to move further to the upside. According to that scenario, long positions are recommended with the first target at 0.7220 and the second one at 0.7240.
Resistance levels: 0.7220, 0.7240 and 0.7280
Support levels: 0.7140, 0.7120, and 0.7085