 English
  Русский
 Bahasa Indonesia
 Bahasa Malay
 ไทย
ไทย Español
 Deutsch
 Български
 Français
 Tiếng Việt
 中文
中文 বাংলা
বাংলা हिन्दी
 Čeština
 Українська
 Română

The pair holds gains above the 200 SMA on H1 chart, but the upside is limited by the strong resistance at the 1.2343 level. If GBP/USD attempts a rally above that area, we can expect a re-test of January 18th highs around 1.2416. However, the Cable is still within a very complex structure for the short term, as it's trapped inside a wide sideways range.
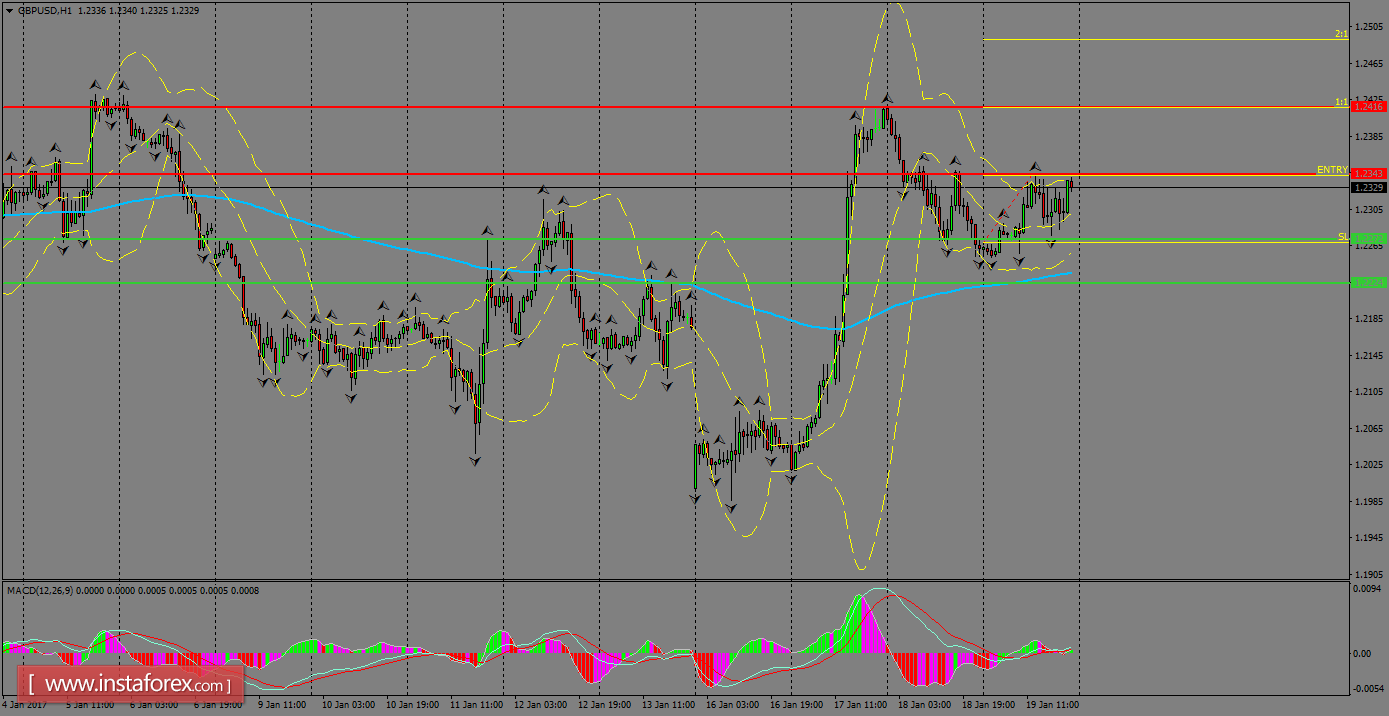
H1 chart's resistance levels: 1.2343 / 1.2416
H1 chart's support levels: 1.2371 / 1.2291
Trading recommendations for today: Based on the H1 chart, buy (long) orders only if the GBP/USD pair breaks a bullish candlestick; the resistance level is at 1.2343, take profit is at 1.2416 and stop loss is at 1.2268.