English
  Русский
 Bahasa Indonesia
 Bahasa Malay
 ไทย
ไทย Español
 Deutsch
 Български
 Français
 Tiếng Việt
 中文
中文 বাংলা
বাংলা हिन्दी
 Čeština
 Українська
 Română

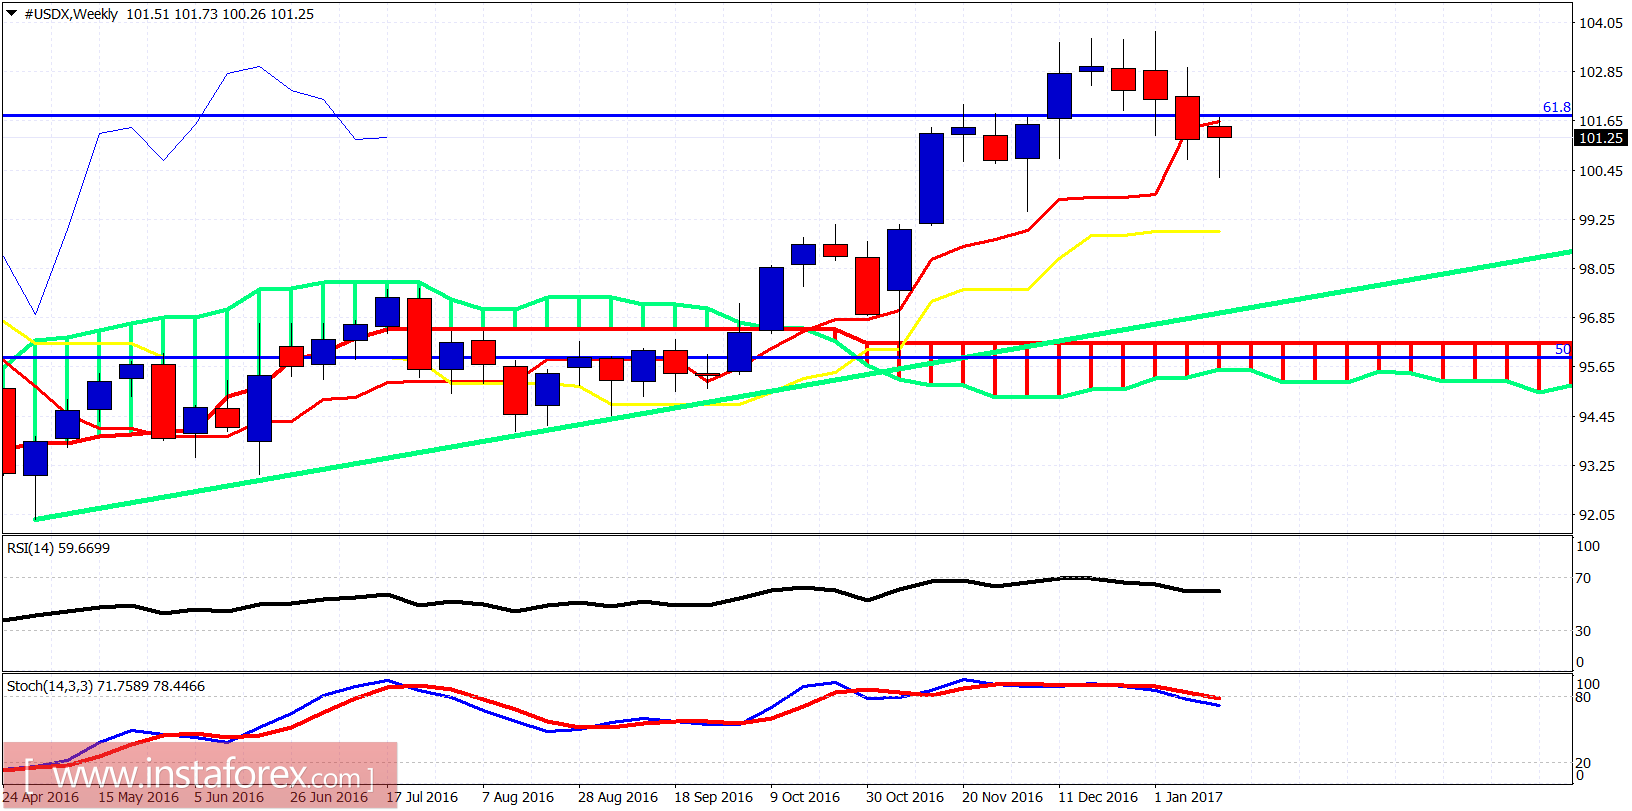
The Dollar index bounced as we expected towards 101 and a bit higher. Trend remains bearish as price remains inside the bearish channel and I believe this is another shorting opportunity for the Dollar index. I do not believe we have seen the lows in the index and we should prepare for new lows.
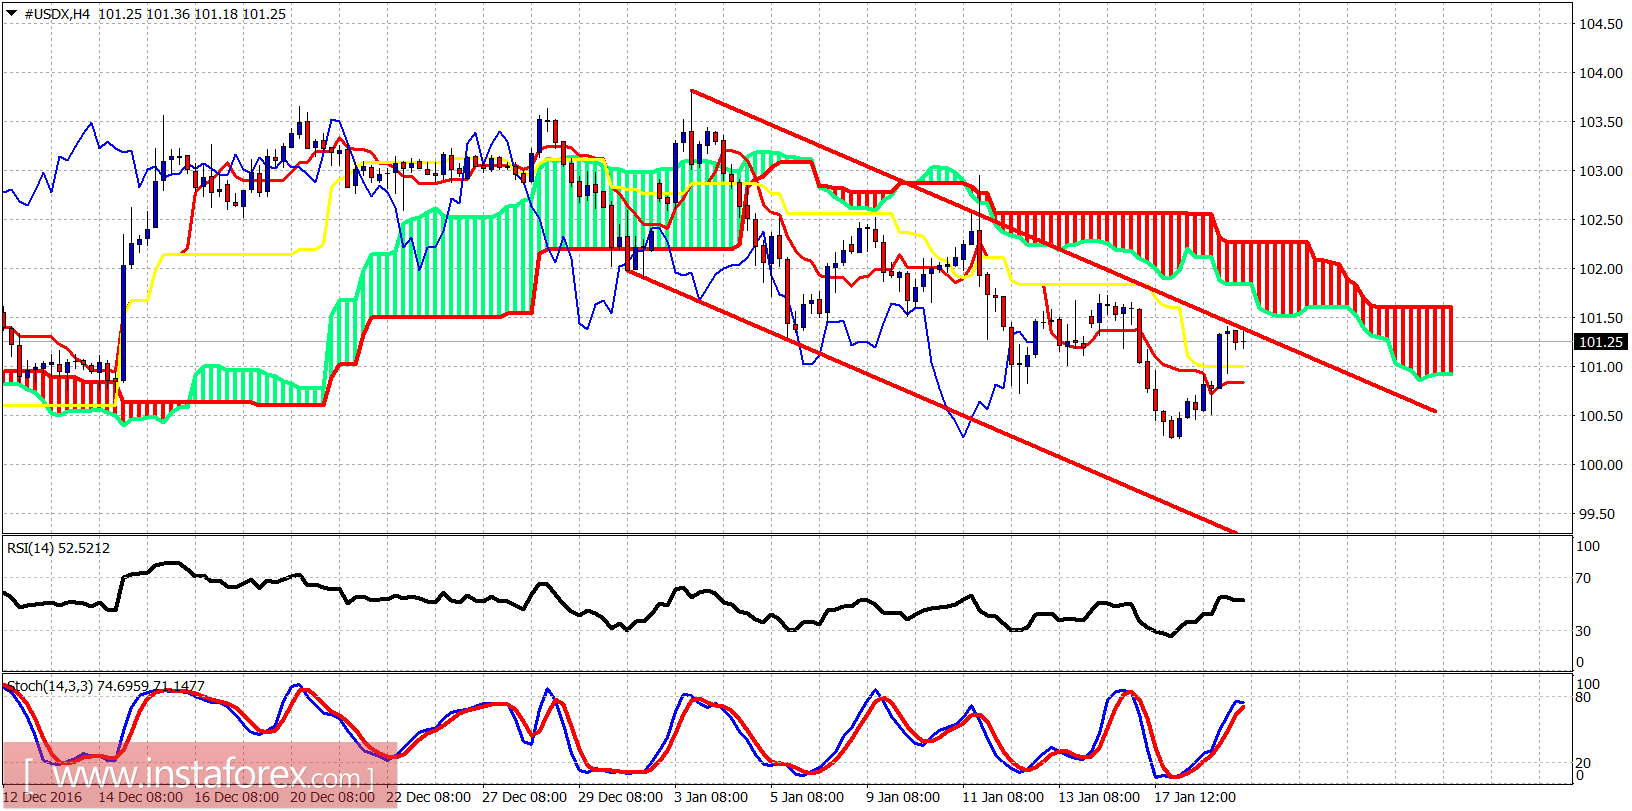
The Dollar index is trading below the Ichimoku cloud on the 4-hour chart. Short-term resistance is here at 101.50 and support at 101. Breaking below 101 will increase the chances of my bearish view for a new low towards 100.