 English
  Русский
 Bahasa Indonesia
 Bahasa Malay
 ไทย
ไทย Español
 Deutsch
 Български
 Français
 Tiếng Việt
 中文
中文 বাংলা
বাংলা हिन्दी
 Čeština
 Українська
 Română

The Dollar index made a lower high and pulled back down towards 101.50 yesterday but support at 101.28 held. Bulls are trying to push the index higher today and currently short-term resistance at 102.10 is being tested.
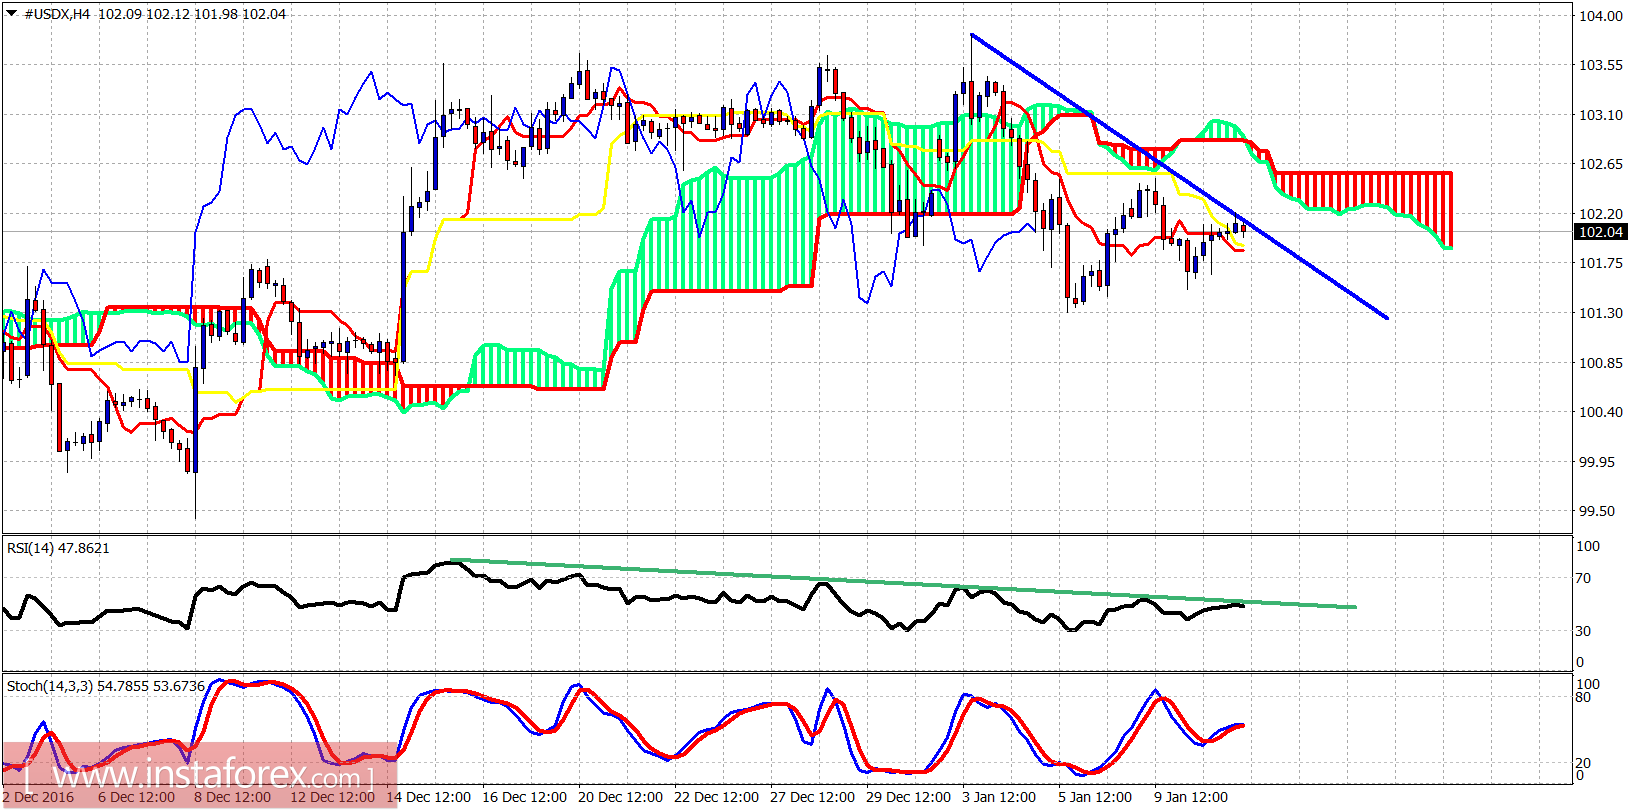
Green line - divergence
The Dollar index is testing short-term resistance at 102.10. If broken we are going to see a bounce towards 102.50 where the most important short-term resistance is found. Support is at 101.28 and if broken we should expect a sharp decline towards 100-99
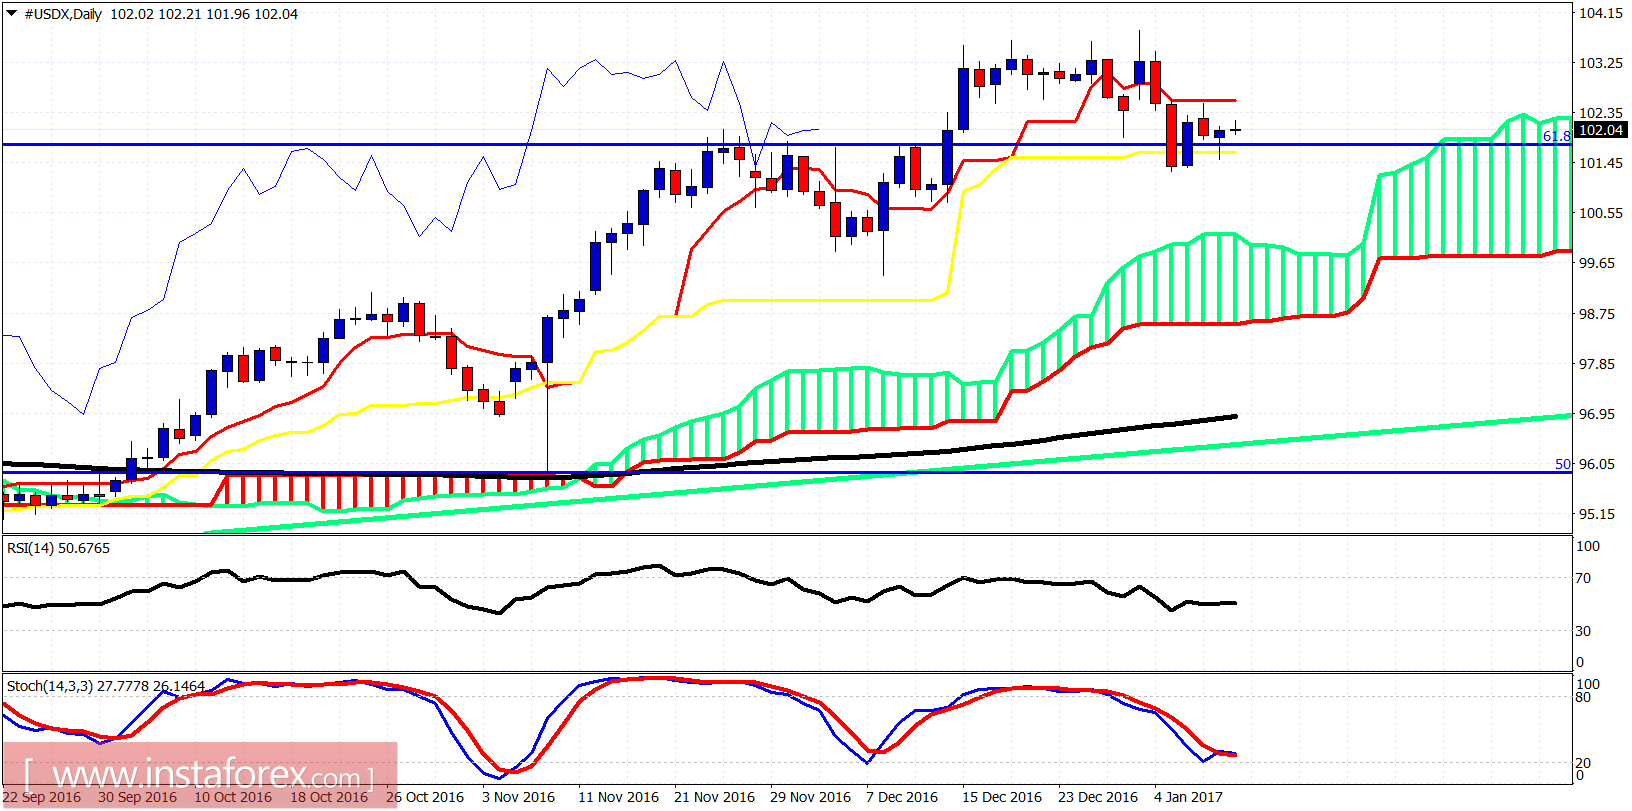
On a daily basis trend remains bullish as price is making higher highs and higher lows. Price is currently trapped between the tenkan- and kijun-sen (red and yellow line indicators). A daily breakout will confirm the next big move in the index either to new highs or towards the Ichimoku cloud support at 100.