 English
  Русский
 Bahasa Indonesia
 Bahasa Malay
 ไทย
ไทย Español
 Deutsch
 Български
 Français
 Tiếng Việt
 中文
中文 বাংলা
বাংলা हिन्दी
 Čeština
 Українська
 Română

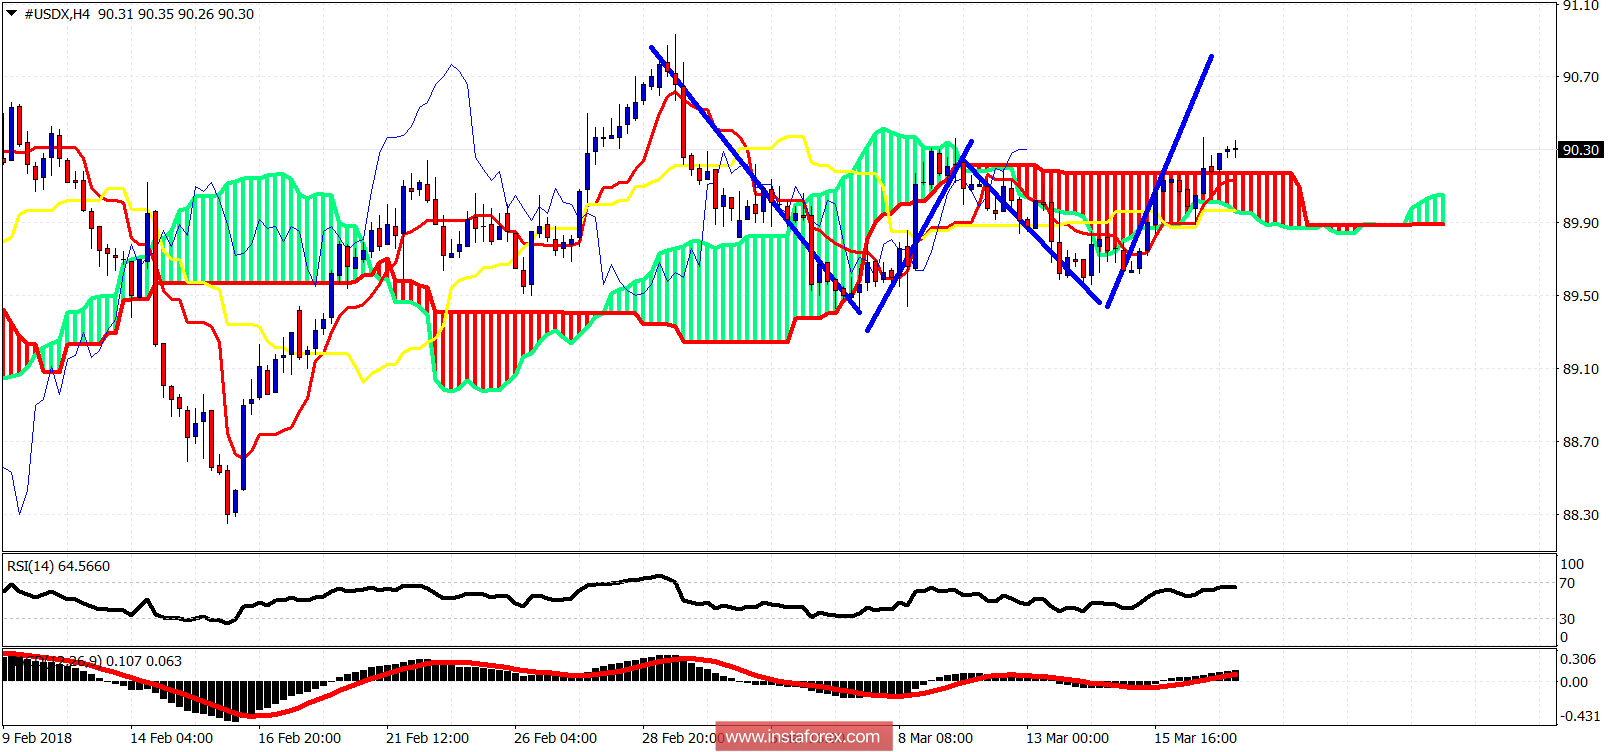
The Dollar index is in a bullish short-term trend. Price is breaking above the Ichimoku cloud in the 4-hour chart while price has formed a W-reversal pattern.
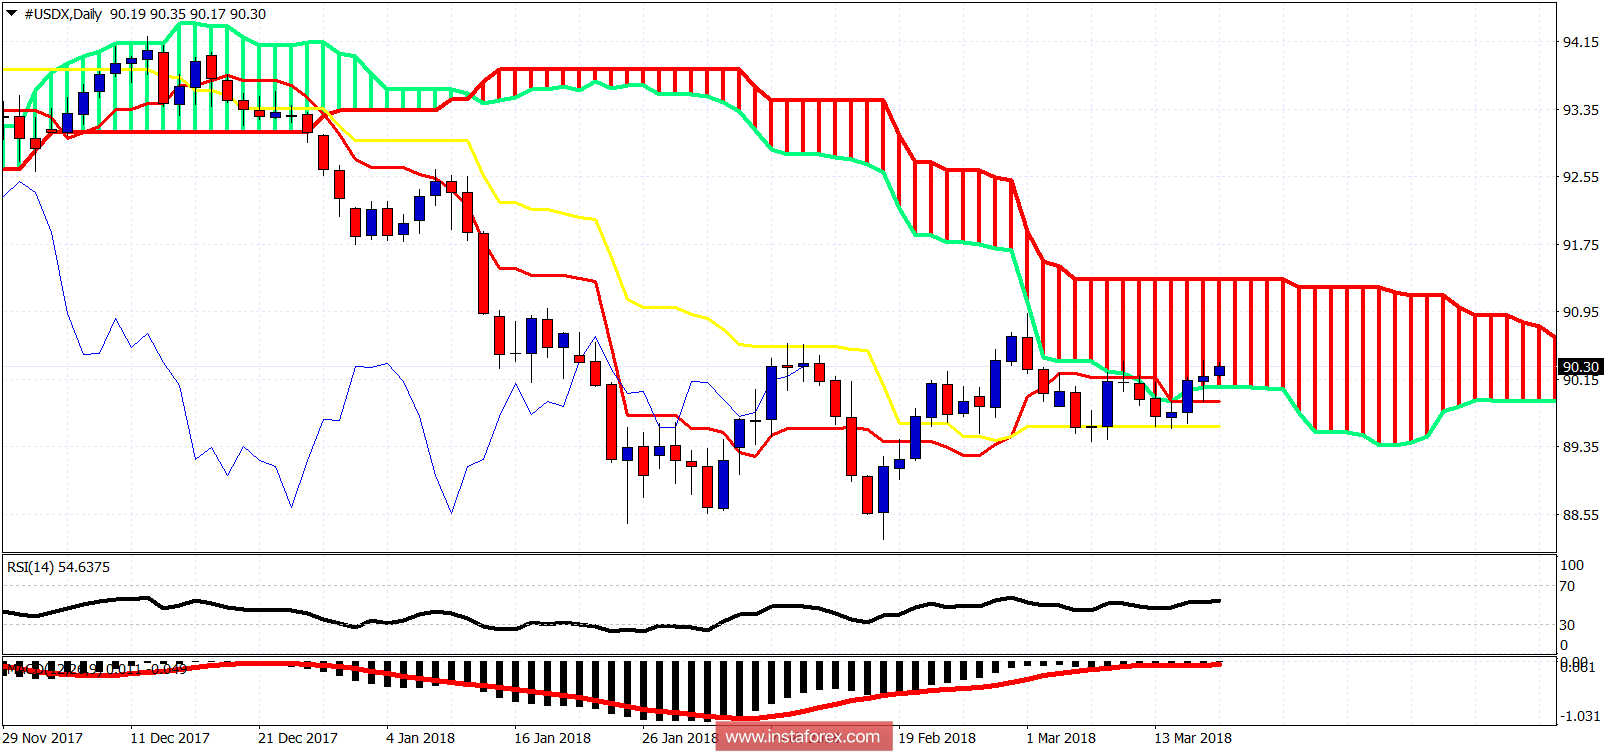
On a daily basis, the Dollar index has broken inside the Daily Kumo. Trend has changed to neutral. Resistance is at the upper cloud boundary at 91.35. For a bigger bounce bulls need to break above the cloud. On the other hand, Dollar bears will need to see price close for at least one day below the cloud (below 90). For now bulls seem to be gaining control of the trend.