 English
  Русский
 Bahasa Indonesia
 Bahasa Malay
 ไทย
ไทย Español
 Deutsch
 Български
 Français
 Tiếng Việt
 中文
中文 বাংলা
বাংলা हिन्दी
 Čeština
 Українська
 Română
FX.co ★ Forex Traders Portal
Top News
Most Read

Yen may rise despite geopolitical tensions
The stock market in Japan is again facing difficulties, discouraging traders. The stock market slumped because of geopolitical turmoil and the volatility of the national currency. According to Bloomberg...
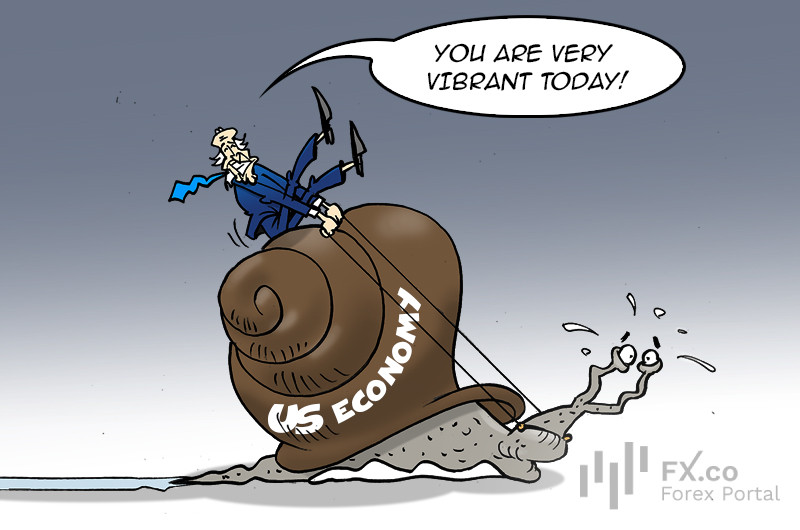
US economy stays afloat despite gloomy predictions
Many experts noted the slowdown in the US economy, but it has outplayed everyone. The US remains the global financial leader. In addition, from February through April 2024, economic activity...
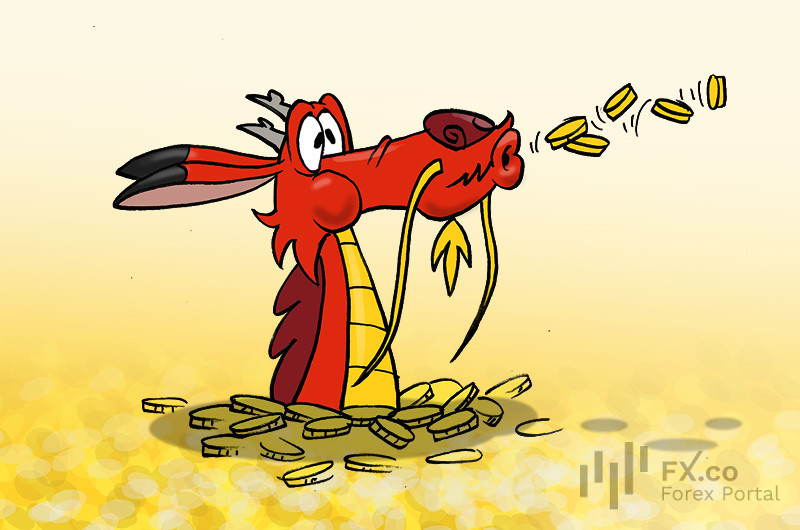
China beefs up reserves, pushing gold higher
The Chinese authorities have recently developed an appetite for gold. The government is increasingly purchasing the precious metal, pushing it to a record-breaking $2,400 per ounce. According to Bloomberg, China...

 Relevance until
On Fire: BEFE Coin’s Unstoppable Trending Momentum
Have you been closely following the crypto market lately? If yes, then you must have seen the epic rise of the BEFE coin out of the blue in the market...
Bitgert Coin’s Trending Resonance: A Closer Look at the Buzz
Since its launch, the Bitgert coin has crossed major milestones in its journey to become one of the most valuable fiat assets any investor can hope for. With...
Arbitrum Price Searches For Support at $1, But Will ARB Find It?
Key Takeaways Arbitrum failed to make a breakout above its descending channel. The ARB price is retesting $1 but is unlikely to hold. The next lower low could be below...
Data Protocol Syntropy Rebrands to Synternet to Enhance Web 3.0 Interoperability
Coinspeaker Data Protocol Syntropy Rebrands to Synternet to Enhance Web 3.0 Interoperability The future of Web 3.0 is about to face a revolution as Syntropy announced its rebranding to Synternet...

What Is Happening With BONK?
BONK is trending in the crypto market for its last few days of gains. More importantly, these gains have happened when the crypto market is pulling down the token values...

Swiss National Bank Casts Doubt On Bitcoin As Reserve Currency
In a recent statement, Chairman Thomas Jordan reiterated the Swiss National Bank’s cautious stance regarding the integration of Bitcoin into its currency reserves. Despite mounting pressure from campaigners pushing...